


The article focuses on answering some of the frequently asked Kubernetes questions in interviews. These questions will help you prepare for your interview by polishing your understanding of Kubernetes concepts.
Q. What is Kubernetes?
Kubernetes, also known as K8s, is an open-source container orchestration platform that performs different tasks like deployment, scaling, management, and monitoring containerized applications. It eases the management and deployment of the applications in an automated manner. It can manage applications on a cluster of servers on the cloud or on-premise.
Q. What are the components of Kubernetes?
Here are the components included in a Kubernetes cluster:
- Pods: They are the smallest and most basic units of computation in Kubernetes. A Pod is a group of one or more containers that share the same network and storage resources and are deployed on the same host. Pods are ephemeral, meaning that they can be created and destroyed at any time. They are usually managed by higher-level controllers, such as deployments, which ensure that their desired number and state are maintained.
- Nodes: These are the physical or virtual machines that run your Pods. Each node has a kubelet, which is an agent that communicates with the master node and manages the Pods on the node. Nodes also have other components, such as a container runtime, a kube-proxy, which handles the network routing for the Pods, and a kube-DNS, which provides DNS services for the Pods.
- Master node: The master node in a Kubernetes cluster oversees the entire cluster's operation and manages the scheduling and deployment of Pods. It coordinates communication between nodes and maintains the desired state of the cluster.
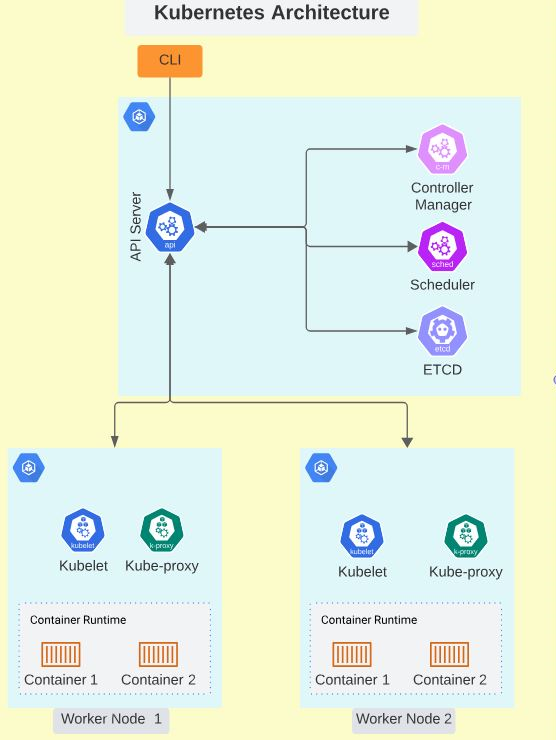
- Control plane: The control plane is the brain of the Kubernetes cluster. It has the API server, scheduler, etcd, and controller manager that handles the orchestration and management of the cluster.
- API server: The API server is the main entry point for all the communications between the nodes and the control plane. It exposes the Kubernetes API, which allows you to interact with your cluster using the kubectl CLI, the Kubernetes dashboard, or other tools and clients.
- Scheduler: The scheduler is responsible for assigning Pods to nodes based on the resource availability and requirements of the Pods.
- Controller manager: The controller manager runs various controllers that monitor and manage the state of your cluster. For example, the replication controller ensures that the desired number of Pods are running for a given deployment, the service controller creates and updates the load balancers for your services, and the node controller handles the node registration and health checks.
- Etcd: Etcd is a distributed key-value store that stores the configuration and state data of your cluster. It is used by the API server and the other control plane components to store and retrieve the cluster information.
Below is an image of the Kubernetes architecture:
Learn more about how Kubernetes works: Demystifying Container Orchestration: How Kubernetes Works with Docker
Q. What are pods?
Pods are the smallest objects that can be deployed on a Kubernetes cluster. A pod can contain one or more containers, and the applications run inside them. These containers share the resources allotted to the pods, like storage, network, etc.
The sample manifest below creates a pod using the busybox image.
apiVersion: v1
kind: Pod
metadata:
  name: busybox
spec:
  containers:
  - image: busybox
    command:
      - sleep
      - "1800"
    imagePullPolicy: IfNotPresent
    name: busybox
Q. How do we see the logs of a pod?
The logs of the pods can be viewed using the following command:
kubectl logs -n <namespace> <pod_name>To tail and follow the logs, we can use the -f and --tail flags.
kubectl logs --tail 100 -f -n <namespace> <pod_name>To learn more about Pod's logs, check out this blog: kubectl logs: How to Get Pod Logs in Kubernetes (With Examples)
Q. How can we debug an issue related to a deployment?
There are multiple ways to check if the deployment running as expected.
1. Check if the deployment has been successfully rolled out. To check the rollout status, run the below command:
kubectl rollout status deployment/<deployment_name>2. Check the events related to the deployment. Run the following command to check the latest events of the namespace:
kubectl get events -n <namespace> --sort-by='.lastTimestamp'We can also get events related to a certain Pod that is not running using this command:
kubectl get events -n <namespace> | grep <pod_name>3. Check the logs of the Pods that are not running as expected. If the Pod is in the CrashBackLoopOff state, then we can check its logs using this command.
kubectl logs -n <namespace> <pod_name>Q. What are services in Kubernetes?
In Kubernetes, services are an abstract way to expose an application running on a set of pods as a network service. They enable network access to a set of pods in Kubernetes, and they provide a consistent way to access the application, regardless of the individual pods' IP addresses or their scheduling. Services can be exposed internally or externally, and they can also be used for load balancing and service discovery within the Kubernetes cluster.
Q. What are the different service types in Kubernetes?
There are several service types that can be used to expose applications running on a set of Pods. The different service types include:
- ClusterIP: This service type exposes the service on an internal IP within the Kubernetes cluster. It is accessible only within the cluster.
- NodePort: NodePort service type exposes the service on a static port on each node's IP. It is accessible outside the cluster using the node's IP address and the NodePort.
- LoadBalancer: This service type exposes the service using a cloud provider's load balancer. It automatically creates the load balancer and assigns a public IP to the service, making it accessible from outside the cluster.
- ExternalName: ExternalName service type maps the service to a DNS name. It is used to provide external access to services running outside the cluster.
Q. How can we enable monitoring of the pods?
To monitor the Pods running on the cluster, we can use the following command to check their utilization:
kubectl top pods -n <namespace>Pod-level metrics can be viewed using the Grafana dashboard as well. Prometheus and Grafana need to be integrated with the metrics that are exposed by Kubernetes.
Kubernetes exposes several metrics that are related to overall cluster health as well as pod-level metrics. The metrics server exposes these metrics and can be accessed using /metrics API.
kubectl get --raw /metricsQ. What are namespaces in Kubernetes?
In Kubernetes, namespaces are a way to divide cluster resources between multiple users (via resource quotas) or to partition resources within the same user group. They are intended for use in environments with many users spread across multiple teams or projects.
Namespaces help in organizing and isolating cluster resources, such as pods, services, and replication controllers, into distinct groups. This allows for better management, segregation, and visibility of resources within the cluster.
We can check the resources that can be namespaced using the command below:
kubectl api-resources --namespaced=TrueQ. How do we persist the data related to the applications in Kubernetes?
To persist the application-related data, we need to create PVC and use it as a mount point while creating a Pod. Below is an example of creating a PVC.
apiVersion: v1
kind: PersistentVolumeClaim
metadata:
 name: pvc-application
spec:
 accessModes:
   - ReadWriteOnce
 resources:
   requests:
     storage: 1Gi
After creating a PVC, the name of the PVC needs to be referred to in the Pod definition file.
apiVersion: v1
kind: Pod
metadata:
  name: nginx-pod-pvc
spec:
  volumes:
    - name: pod-volume-pvc
      persistentVolumeClaim:
        claimName: pvc-application
  containers:
    - name: task-pv-container
      image: nginx
      ports:
          - containerPort: 80
      volumeMounts:
          - mountPath: "/data/nginx/"
            name: pod-volume-pvc
Q. What are PV and PVC?
PV stands for PersistentVolume and PVC stands for PersistentVolumeClaim. PersistentVolume creates a storage volume so that users can claim a specific amount of storage from it. The PV can be created using different volume provisioners like Local, NFS, CephFS, GCEPersistentDisk, AWSElasticBlockStore, AzureFile, etc.
PersistentVolumeClaim allows the users to claim storage resources from PV. Just like Pods can request resources like CPU and memory, PVCs can ask for storage resources from PV with certain access modes.
kind: PersistentVolume
apiVersion: v1
metadata:
  name: postgres-pv
spec:
  storageClassName: local
  capacity:
    storage: 10Gi
  accessModes:
    - ReadWriteOnce
  hostPath:
    path: "/data"
---
apiVersion: v1
kind: PersistentVolumeClaim
metadata:
  labels:
    app: postgres
  name: postgres-pv-claim
spec:
  storageClassName: local
  accessModes:
  - ReadWriteOnce
  resources:
    requests:
      storage: 1Gi
Q. How can we regulate access to the Kubernetes cluster?
To regulate access to the Kubernetes cluster, you can use Role-Based Access Control (RBAC) to define fine-grained access policies. RBAC allows you to specify what actions are allowed and denied for different users and service accounts within the cluster. You can create roles and role bindings to grant permissions to specific resources, such as pods, services, and deployments.
Additionally, you can leverage network policies to control traffic flow between pods and define which pods are allowed to communicate with each other. Regularly reviewing and updating access control policies is important to maintain a secure Kubernetes cluster.
Q. What is the difference between Role and ClusterRole?
In Kubernetes, a Role is used to define permissions within a specific namespace, while a ClusterRole defines permissions across the entire cluster. This means that a Role is limited to a specific namespace and can only grant permissions within that namespace, whereas a ClusterRole can grant permissions across all namespaces in the cluster.
Q. What is the difference between RoleBinding and ClusterRoleBinding?
RoleBinding and ClusterRoleBinding are both Kubernetes objects that associate roles with subjects, such as users or groups. The main difference between the two is the scope of the permissions they grant.
RoleBinding:
- RoleBinding is used to bind a role to a specific namespace.
- It grants permissions within that namespace only.
- It allows you to grant access to resources within a specific namespace.
ClusterRoleBinding:
- ClusterRoleBinding is used to bind a cluster-wide role to a subject.
- It grants permissions across all namespaces in the cluster.
- It allows you to grant access to resources across the entire cluster.
Q. How do we interact with the Kubernetes cluster?
We can interact with the Kubernetes cluster using the kubectl tool. We can use kubectl to deploy applications, manage the cluster, and monitor the pods.
We can also use the Kubernetes Dashboard to interact with the cluster. The dashboard allows users to create deployments, view pod logs, monitor the usage of the nodes, etc.
Q. How can we use Kubernetes on a single machine?
To set up Kubernetes on a local machine, we can use a tool such as minikube or Kind. Both are open-source binaries that can create a local Kubernetes environment on your machine.
Q. How can we check the utilization of the nodes?
We can check the utilization of the nodes in the cluster using the command below:
kubectl top nodesIf available, we can also use the Kubernetes dashboard to monitor the utilization of the nodes. We can also integrate the cluster with the Prometheus-Grafana stack to monitor and alert the cluster.
Q. What are the access modes used while creating PVCs?
The access modes in PersistentVolumeClaim (PVC) are as follows:
- ReadWriteOnce (RWO) - It ensures only one node can read or write on the mounted volume. Multiple pods running on the same node can also access the volume.
- ReadOnlyMany (ROX) - Multiple nodes can mount the volume as read-only.
- ReadWriteMany (RWX) - Multiple nodes can mount the volume as read-write.
- ReadWriteOncePod (RWOP) - The volume can be mounted as read-write by a single pod. It is used when we want to ensure only one pod can read or write on the mounted volume.
Q. How do we regulate the pods' resource usage?
To regulate the resources for the pods, we make use of the ‘resources’ parameter while creating the pods. We can request and limit the resources that a pod can consume. This allows us to control various resources required for the pods, like storage, CPU, memory, etc. Below is an example showing how to control the pods' resource usage.
apiVersion: v1
kind: Pod
metadata:
 name: resource-control-example
spec:
 containers:
 - name: container-of-pod
   image: nginx
   resources:
     requests:
       ephemeral-storage: "1Gi"
       memory: "500Mi"
       cpu: "50m"
     limits:
       ephemeral-storage: "2Gi"
       memory: "1Gi"
       cpu: "100m"
Q. What are the different types of container patterns?
- Sidecar container pattern
- Init container pattern
- Ambassador pattern
- Adapter pattern
- Work Queue pattern
- Leader Election pattern
- Scatter/Gather pattern
- Single container pattern
Q. How can we find out the details about the pods?
We can get more details regarding the pod using the below command:
kubectl describe pod <pod_name> -n <namespace>This command can provide details such as the IP of the node where the pod has been assigned, the IP of the pod, service endpoints, the status of the pod, the image used for running the pod, volumes mounted to the pod, and resource specifications of the pod, etc.
Check out our Kubernetes Learning Path to start learning Kubernetes today.
Conclusion
This guide covers many topics, including the basics of Kubernetes, pod management, logging, monitoring, namespaces, persistent data, access control, and interacting with the Kubernetes cluster. It also provides insights into regulating resource usage, different container patterns, and retrieving detailed pod information.
Overall, this guide is a valuable resource for anyone preparing for Kubernetes-related interviews, as it covers essential concepts and practical commands. Good luck with your interview preparation!
More on Kubernetes:
- Deploying, Maintaining, and Scaling Kubernetes Clusters
- Kubernetes Readiness Probe: A Simple Guide with Examples
- How to Restart a Pod in Kubernetes
- How to Setup a Kubernetes Cluster with Minikube & Kubeadm
- How to Use Kubectl Delete Deployment (With Examples)
- What Are Objects Used for in Kubernetes? 11 Types of Objects Explained.


Discussion