


Once the applications have been deployed in the production environment, managing and maintaining them is crucial. Properly monitoring these applications ensures they run as expected and helps prevent downtime. Grafana-Prometheus stack is one of the most commonly used monitoring stacks. It can be deployed over the cloud or as an on-premise solution.
This article will explore Prometheus and Grafana's capabilities and how they work. It also includes a demo of how to deploy them.
What is Prometheus? How does it work?
Prometheus is an open-source monitoring tool that stores data in a time-series format. It pulls the metrics from different exporters and stores them as a time series. Each time series can be uniquely identified using a combination of metric names and labels that are in key-value pairs.
The labels help differentiate the time series by having the same metric name.
For instance, if you have configured Prometheus to scrape the metrics of the node exporter running on two different nodes. The metric names sent by the node exporter will be the same, but the corresponding labels will be different as they run on different nodes.
Targets must be defined in the Prometheus configuration file to collect the metrics. Each target corresponds to the exporters that provide the metrics. There are many exporters available in the market that allow better monitoring of the services and infrastructure.
Prometheus also provides a query language called PromQL that enables querying over the metrics that have been fetched. It allows aggregation over time-series data using the pre-built functions.
Check out our Prometheus Certified Associate Course:

.png)
What is Grafana? How does it work?
Grafana is a data visualization tool that helps monitor the state of the infrastructure and applications. It can query data, create dashboards, and send alerts to different channels. The dashboards offer better data visibility and help avoid production issues by monitoring the system at all times.
Custom plugins can be used to integrate Grafana with other data sources and data visualizations. It connects with databases like Prometheus, Elasticsearch, InfluxDB, MySQL, PostgreSQL, Graphite, etc.
After connecting to these data sources, dashboards can be created. These dashboards can be restricted to users with certain rights through user access management. Apart from the open-source solution, Grafana provides Cloud and Enterprise solutions.
What is Alertmanager? How does it work?
Alertmanager is an alerting tool that talks to Prometheus and sends alerts to different channels. The channels can be in PagerDuty, Email, Telegram, Slack, etc. We can also send these alerts to other platforms like Teams using webhooks. These webhooks must be created at the channel, and the URL must be provided in the Alertmanager configuration.
The rules that need to be monitored are provided in the Prometheus configuration. When one of these rules gets triggered, Prometheus conveys the trigger to Alertmanager. Alertmanager will then send the alert to the channel to notify the users about the rule trigger. Alertmanager allows the alerts to be silenced to prevent repeatedly notifying about the same rule triggers.
Getting Started with Prometheus and Grafana
One of the easiest ways to set up the monitoring stack is through a docker-compose file. Here is the graphical representation of the setup:
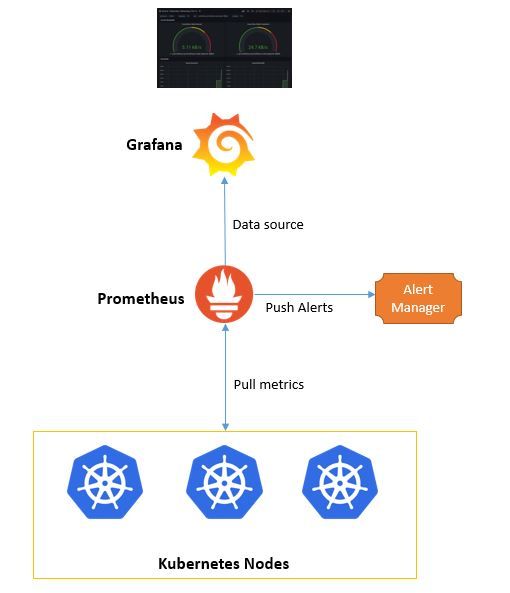
In the docker-compose file, we will set up the following four services:
- Prometheus - Fetch the metrics from different targets mentioned in the configuration file. The configuration needs to be changed if more targets need to be monitored.
- Grafana - To visualize the dashboards. It is pre-configured with Prometheus as a data source. To add more data sources, you can edit the datasources.yml file. After importing the node exporter dashboard, you shall be able to see the following dashboard on Grafana UI:
- Alertmanager - It sends alerts to different channels. The details specific to the channels, like user details, webhook URLs, etc., must be entered in the configuration file.
- Node exporter - An exporter that provides the host metrics like CPU, Memory, Mountpoint storage, etc. It needs to be deployed on each of the systems that are to be monitored.
version: "3.7"
services:
  prometheus:
    image: prom/prometheus:v2.36.0
    volumes:
      - ./prometheus/prometheus.yaml:/etc/prometheus/prometheus.yml
      - ./prometheus/rules.yml:/etc/prometheus/rules.yml
      - prometheus_data:/prometheus
    command:
      - '--config.file=/etc/prometheus/prometheus.yml'
      - '--storage.tsdb.path=/prometheus'
    ports:
      - 9090:9090
    networks:
      - monitoring-stack
  grafana:
    image: grafana/grafana:9.0.0-beta2
    volumes:
      - ./grafana/grafana.ini:/etc/grafana/grafana.ini
      - ./grafana/datasources.yml:/etc/grafana/provisioning/datasources/datasource.yaml
    ports:
      - 3000:3000
    networks:
      - monitoring-stack
  node-exporter:
    image: prom/node-exporter:v1.3.1
    restart: unless-stopped
    ports:
      - 9100:9100
    volumes:
      - /proc:/host/proc:ro
      - /sys:/host/sys:ro
      - /:/rootfs:ro
    command:
      - '--path.procfs=/host/proc'
      - '--path.rootfs=/rootfs'
      - '--path.sysfs=/host/sys'
      - '--collector.filesystem.mount-points-exclude=^/(sys|proc|dev|host|etc)($$|/)'
    networks:
      - monitoring-stack
  alertmanager:
    image: prom/alertmanager:v1.3.1
    ports:
      - 9093:9093
    volumes:
      - ./alertmanager/config.yml:/etc/alertmanager/config.yml
    networks:
      - monitoring-stack
    restart: always
    command:
      - '--config.file=/etc/alertmanager/config.yml'
      - '--storage.path=/alertmanager'

networks:
        monitoring-stack:
                driver: bridge
volumes:
        prometheus_data:
Steps to deploy the monitoring stack:
As a prerequisite, you must install Docker, Docker-compose, and Git on the systems. These are required to deploy the services.
Step 1: Clone the git repository using the command below. This repository contains all the required artifacts for deploying the monitoring stack.
git clone https://github.com/thakarprathamesh/monitoring-stack.gitStep 2. Start the services by using the compose file. You can edit the compose file as required. Use the below command to start the services.
docker-compose -f monitoring-docker-compose.yaml up -dYou can access the services at the following URLs:
- Grafana - http://localhost:3000 (Enter default credentials of Grafana, i.e., username - admin, password - admin to access the UI)
- Prometheus UI at http://localhost:9090
- Alertmanager UI at http://localhost:9000
Try Grafana-Prometheus using KodeKloud
You can also access Grafana and Prometheus instantly via KodeKloud. It provides a playground for the users to get hands-on with the Grafana-Prometheus stack.
Conclusion
A monitoring stack should be able to monitor the clusters with real-time dashboards that visualize the most critical KPIs. It should also be able to alert the stakeholders in case of an issue or if a certain threshold has been breached. Not using a monitoring stack can lead to serious production issues, such as the degradation of the application's performance.
People are also reading:


Discussion