


DevOps practices continue to evolve year by year as new technologies emerge, driving the need for monitoring solutions that can keep up the pace. In 2024, staying ahead in DevOps requires leveraging the most advanced monitoring tools available. These tools not only ensure system reliability but also enhance the overall productivity of teams. In this article, we will delve into the essence of DevOps monitoring, including what you should monitor, and, most importantly, explore the best monitoring tools to learn.
Key Takeaways
- Critical monitoring areas include application performance, infrastructure health, network reliability, and cost management.
- Open-source tools are crucial for adaptable and cost-efficient monitoring in DevOps.
- Successfully deploying monitoring tools requires setting precise monitoring goals, configuring alerts thoughtfully, and fostering a culture of collaboration.
What Is DevOps Monitoring?
DevOps monitoring is the practice of continuously observing and analyzing the performance and health of various components within a software delivery pipeline. This includes monitoring applications, infrastructure, networks, and services to ensure they are functioning optimally. The primary goal of DevOps monitoring is to provide real-time insights and feedback that enable teams to detect and resolve issues quickly.
Types of Monitoring in DevOps: What Should You Monitor?
Effective monitoring in a DevOps environment is crucial for ensuring smooth operation. Here are four key areas you should monitor:
- Application Performance Monitoring (APM)
Monitoring the performance of applications is a critical aspect of DevOps. APM tools track metrics such as response times, error rates, and resource utilization, providing insights into the user experience and application health. Failure to monitor application performance can lead to poor user experiences, increased downtime, and potential revenue losses.
- Infrastructure Monitoring
DevOps teams must monitor the underlying infrastructure, including servers, virtual machines, containers, and cloud resources. Infrastructure monitoring tools track resource utilization (CPU, memory, disk, network), availability, and performance, enabling teams to proactively identify and resolve issues before they impact applications.
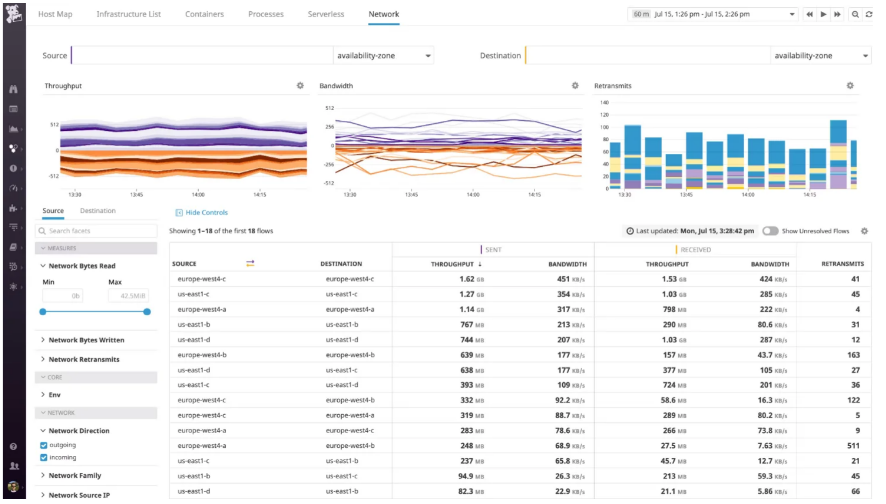
- Network Monitoring
Network performance and reliability are essential for distributed applications and microservices architectures. Network monitoring tools track metrics such as latency, throughput, and packet loss, helping teams identify and troubleshoot network-related issues that can affect application performance.
- Cost Monitoring
In this cloud-native era, monitoring costs associated with cloud resources and infrastructure is crucial for effective resource management and cost optimization. Cost monitoring tools provide visibility into cloud spend, enabling teams to identify and address inefficiencies, optimize resource utilization, and control costs.
Factors To Consider When Choosing A DevOps Monitoring Tool
Selecting the right monitoring tool for your DevOps environment is crucial for ensuring effective monitoring. When evaluating potential tools, consider the following key factors:
- Scalability
As your applications and infrastructure grow, your monitoring solution must be able to scale seamlessly. Look for tools that can handle increasing workloads, resources, and data volumes without performance degradation or the need for complex reconfigurations.
- Integration Capabilities
DevOps environments often involve a diverse set of technologies and tools. Choose a monitoring tool that integrates seamlessly with your existing infrastructure, applications, and DevOps toolchain. This ensures comprehensive visibility and streamlined workflows.
- Visualization and Reporting
Effective monitoring relies on clear and intuitive data visualization and reporting. Look for tools that offer customizable dashboards, real-time data visualization, and flexible reporting options, enabling teams to quickly identify and troubleshoot issues.
- Alerting and Notification
Timely alerts and notifications are crucial for proactive issue resolution. Evaluate the alerting capabilities of the monitoring tool, including customizable thresholds, alert routing, and integration with communication channels.
- Observability and Troubleshooting
Beyond monitoring, look for tools that provide observability features, such as distributed tracing, log analysis, and advanced troubleshooting capabilities. These features enable teams to quickly identify the root cause of issues and resolve them efficiently.
- Cost and Licensing Model
Consider the cost and licensing model of the monitoring tool, ensuring it aligns with your budget and growth plans. Evaluate options like perpetual licenses, subscription-based pricing, or pay-as-you-go models based on your specific requirements.
- Ease of Use and Adoption
The monitoring tool should be user-friendly and easy to adopt for your DevOps team. Look for intuitive interfaces, comprehensive documentation, and training resources to facilitate a smooth onboarding process and ensure effective utilization.
Top DevOps Monitoring Tools By Category
DevOps teams require a diverse set of monitoring tools to gain visibility across the entire application delivery lifecycle. Here are some of the popular tools categorized by their core functionality:
Open-source DevOps Monitoring Tools
Open-source monitoring tools provide cost-effective solutions that can be customized as per requirements. Below are some popular open-source monitoring tools you should learn
- Prometheus
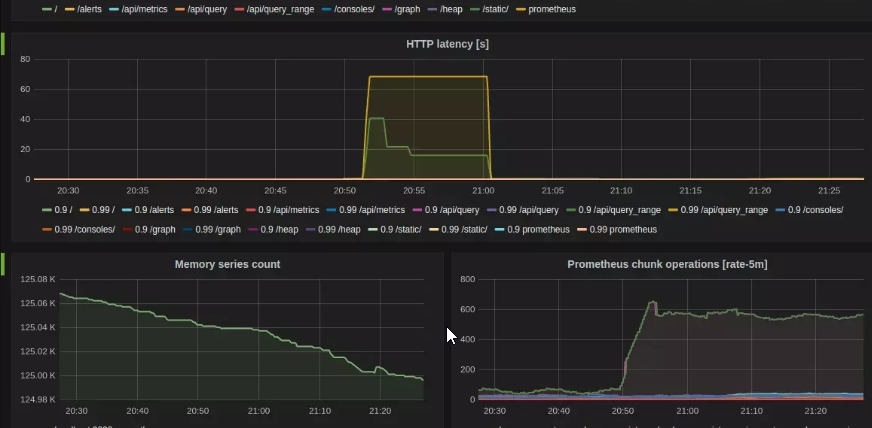
Prometheus is an open-source monitoring and alerting tool originally built at SoundCloud. Prometheus is especially well-suited for monitoring cloud-native, containerized environments. It collects metrics from configured targets, stores them, and allows querying with a flexible query language.
Features:
- Developed in Go, facilitating future advancements.
- Collects metrics from configured targets and stores them.
- Offers flexible query language for data retrieval.
- Integrates easily with PagerDuty.
- No dependencies, providing a comprehensive Web API for custom development.
Getting a Prometheus Certified Associate (PCA) certification demonstrates your understanding of best practices in monitoring cloud-native applications and infrastructure. Prepare for the PCA exam with KodeKloud's Prometheus Certified Associate course, which offers in-depth lectures and a hands-on lab.
- Nagios
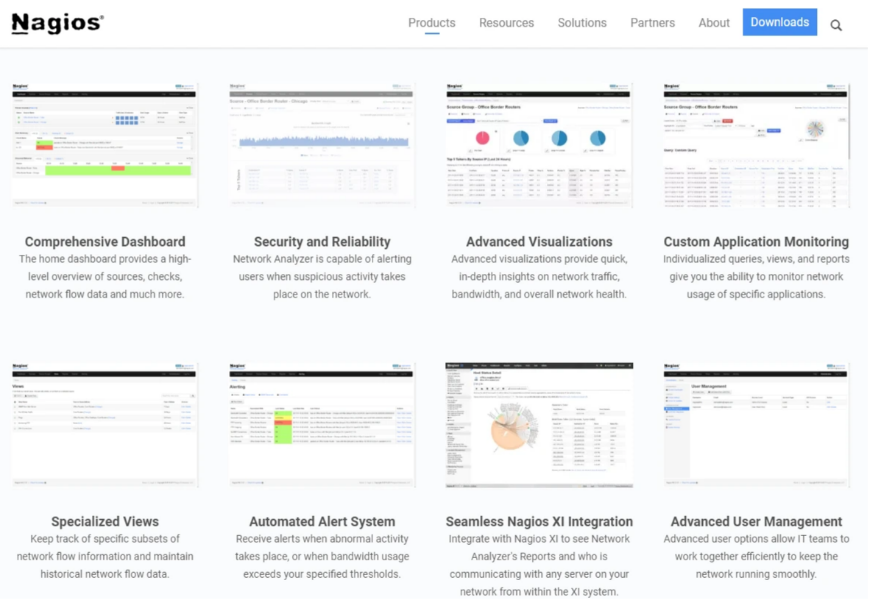
Nagios is one of the pioneering open-source monitoring tools that monitors systems, applications, services, and business processes. It watches hosts and services specified using external plugins and alerts when issues arise.
Features:
- Monitors specified hosts and services using external plugins.
- Alerts users when issues arise.
- Customizable plug-ins for specific requirements.
- Comprehensive documentation for user reference.
- Capability to ping devices within an organization.
- Zabbix
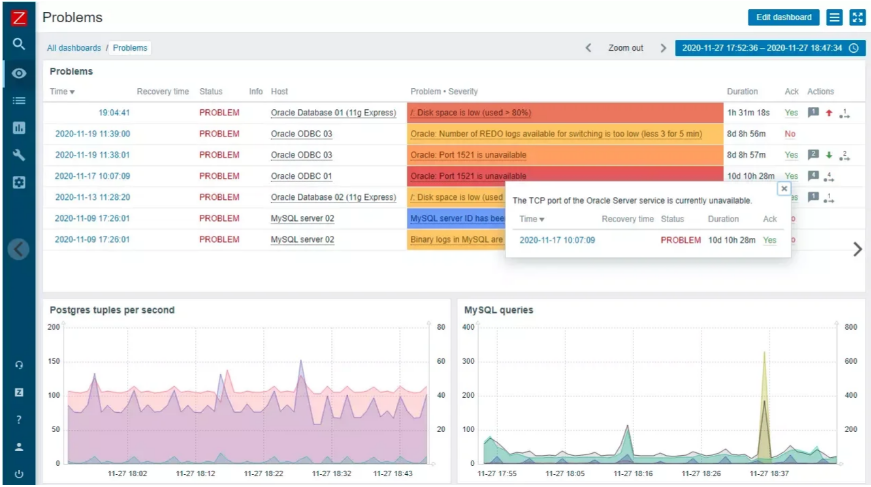
Zabbix is another open-source monitoring solution similar to Nagios. It monitors networks, servers, virtual machines, and cloud services.
Features:
- Comprehensive feature set
- Scalable and suitable for large environments
- High availability.
All-in-One DevOps Monitoring Tools
These commercial tools provide comprehensive observability across the entire stack - infrastructure, applications, network, and end-user experience.
- New Relic
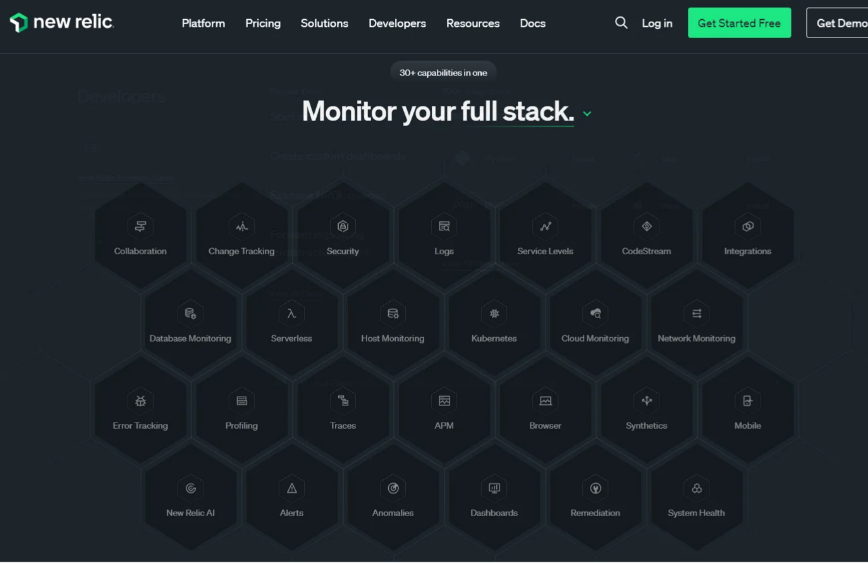
New Relic is an observability platform that brings together logs, metrics, events, and traces into one connected experience.
Features:
- Application performance monitoring.
- Infrastructure monitoring.
- Real user monitoring.
- Synthetic monitoring capabilities.
- Unified platform for all observability data
- Strong visualization and dashboard capabilities
- Dynatrace
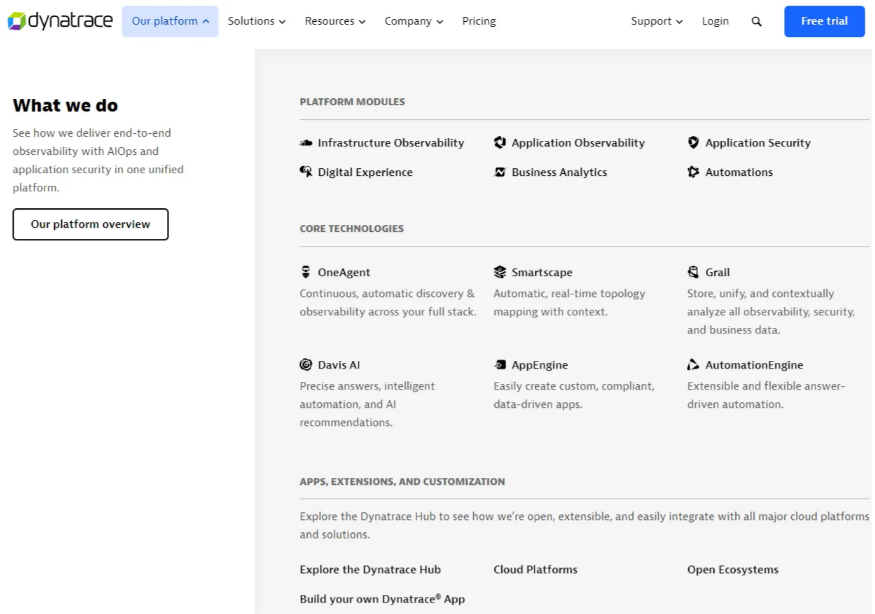
Dynatrace AIOps (Artificial Intelligence for IT Operations) is a comprehensive platform that offers end-to-end observability and intelligent automation for modern, cloud-native applications. It provides automatic and intelligent observability across applications, containers, cloud resources, and end-user experience.
Features:
- AI-driven root cause analysis
- Automated discovery and instrumentation
- Small memory footprint.
- Provides detailed transaction flows and performance insights.
- Detects deviations from standard baselines and unusual activities.
Learn more about How DevOps Can Take Advantage of AI.
- Datadog
Datadog is a monitoring and security platform for cloud applications that collects and analyzes metrics, traces, logs, and more. It provides end-to-end visibility across hosts, containers, serverless functions, and more.
Features:
- Collects and analyzes metrics, traces, and logs.
- Provides comprehensive monitoring across cloud applications.
- Wide integration with cloud services
Application, Network, and Infrastructure Monitoring Tools
While the previous category covered end-to-end solutions, these tools specialize in different monitoring domains.
- Splunk
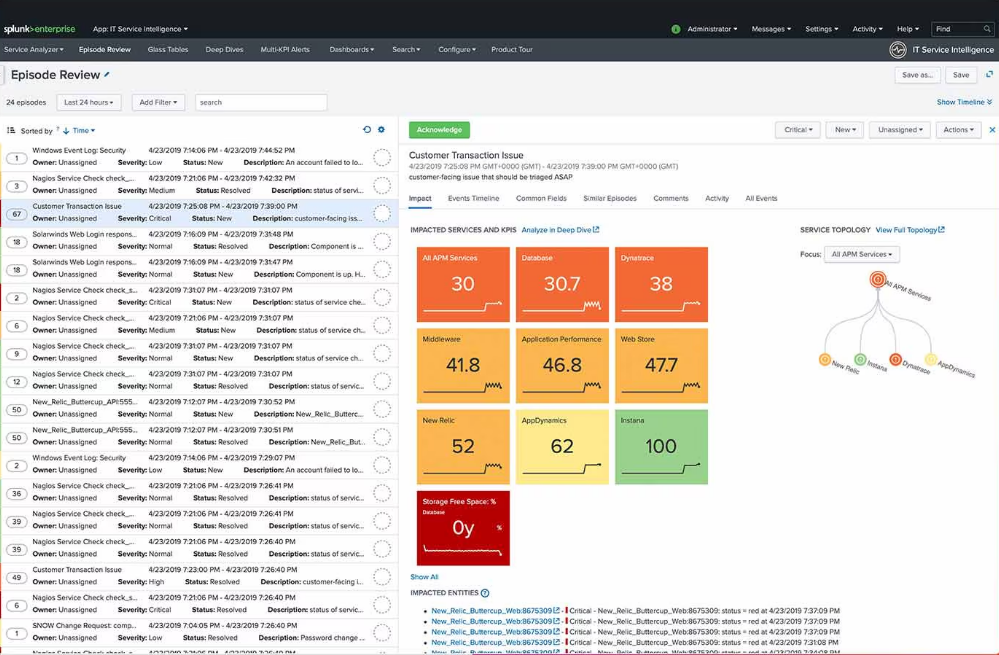
Splunk is primarily focused on analyzing machine data like application logs, infrastructure logs, IoT data, and more.
Features:
- Collects, indexes, and enables searching of massive data streams.
- Analyzes data from various sources, including networks, servers, and applications.
- Provides accurate reports for actionable insights.
- Sensu by Sumo Logic
Sensu is a monitoring events pipeline that enriches data from multiple sources and routes it to handlers for filtering, pre-processing, and escalation.
Features:
- Monitors servers, containers, applications, and business metrics.
- Easy configuration of real-time metrics and alerts.
- Visually appealing dashboards and graphs.
- ChaosSearch
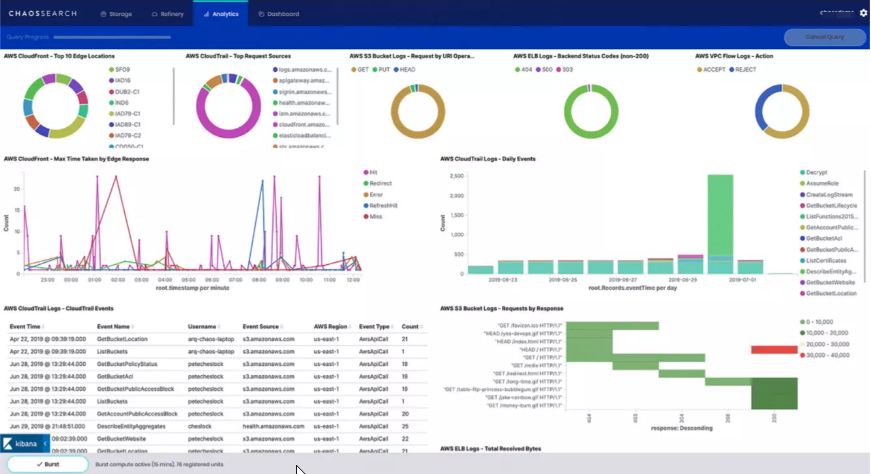
ChaosSearch enables log analytics directly on cloud storage like AWS S3 without needing data movement or transformations.
Features:
- Indexes log and event data in cloud storage for monitoring and analysis.
- Provides full-text search and SQL queries with ML support.
- Lower TCO compared to alternatives.
Data Aggregation and Cross-Domain Enrichment Tools
These tools help correlate and enrich data from disparate monitoring sources:
- Planview Hub (Formerly Tasktop Integration Hub)
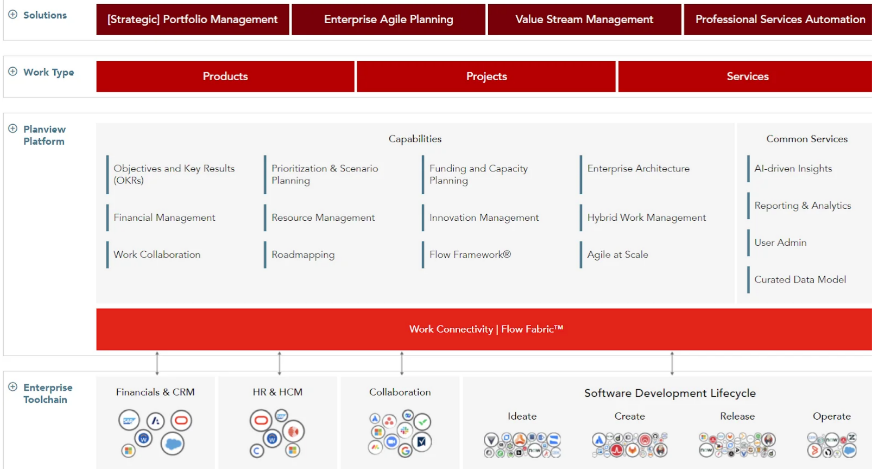
Planview Hub provides model-based integration to connect software delivery tools across the DevOps toolchain. It enables the syncing of data between different DevOps and Agile tools.
Features:
- Enhances data synchronization across tools
- Routes artifacts and specific field updates based on customizable filters.
- Simplifies tool integration.
- BigPanda
BigPanda uses event correlation algorithms to automatically aggregate, enrich, and correlate alerts from different infrastructure and application monitoring sources into high-level insights.
Features:
- Automates alert aggregation and correlation to reduce noise.
- Provides actionable insights.
- Seamlessly connects with multiple IT management tools.
- Handles large volumes of data effectively.
Business Service Health Monitoring Tools
With the rise of digital services, monitoring business metrics has become crucial for DevOps:
- Opsview
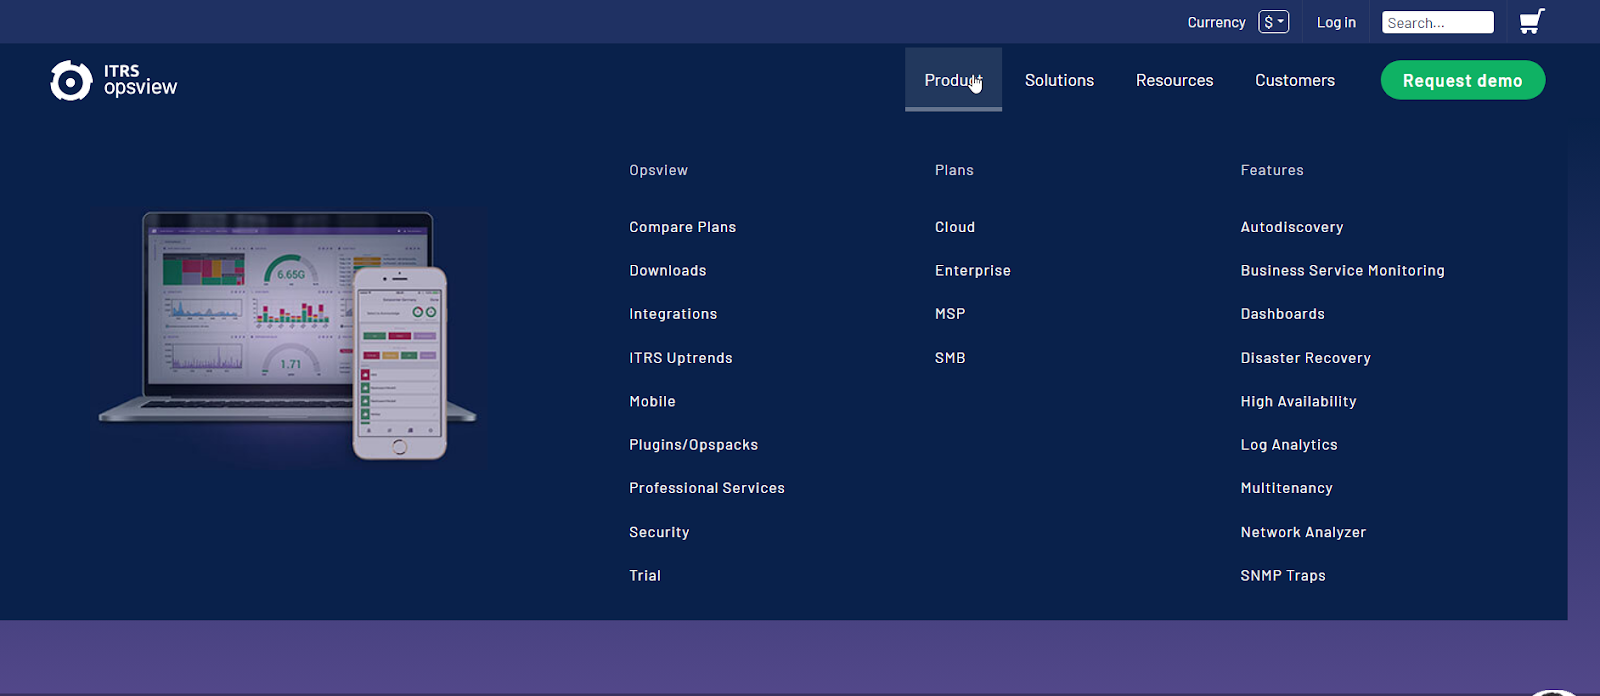
Opsview provides business service monitoring by combining real user monitoring, synthetic monitoring, and application monitoring data. It helps correlate technical issues to business impacts.
Features:
- Combines user, synthetic, and application monitoring
- Shows IT performance impacts on business
- Streamlines alerts and routine tasks.
- Suitable for monitoring complex environments
- Akamai mPulse
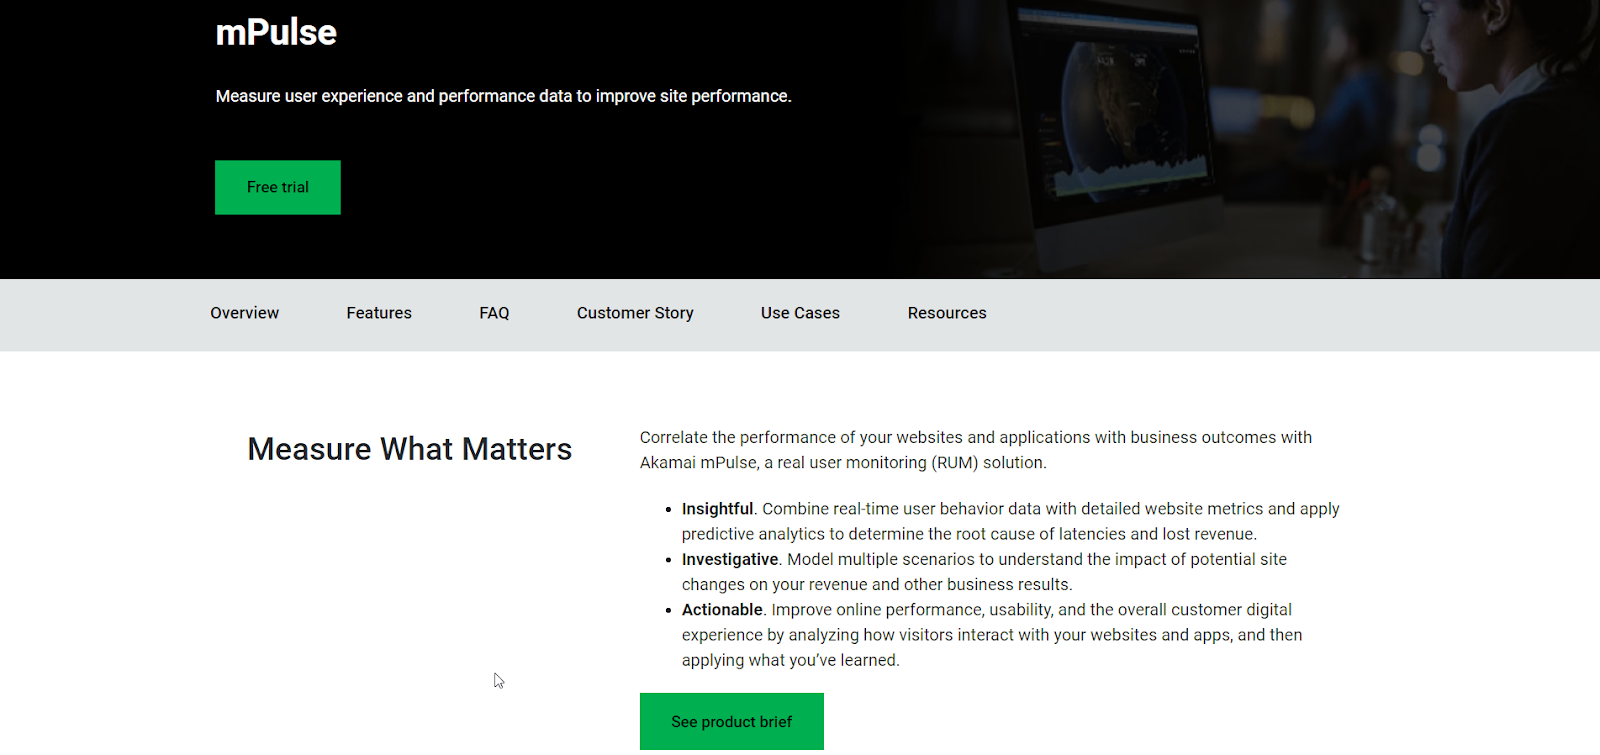
mPulse from Akamai collects extensive real user experience data across 200+ metrics like load times, conversions, errors, and more to identify performance bottlenecks.
Features:
- Easy deployment
- Monitoring for websites and native applications
- Customizable metrics and dashboards
- Real-time user activity insights
Monitoring CI/CD Pipelines and Configurations
Monitoring the CI/CD pipelines is crucial for DevOps teams to ensure smooth software delivery cycles.
Learn more about CI/CD from this blog: How CI/CD Pipeline Works
- AppDynamics
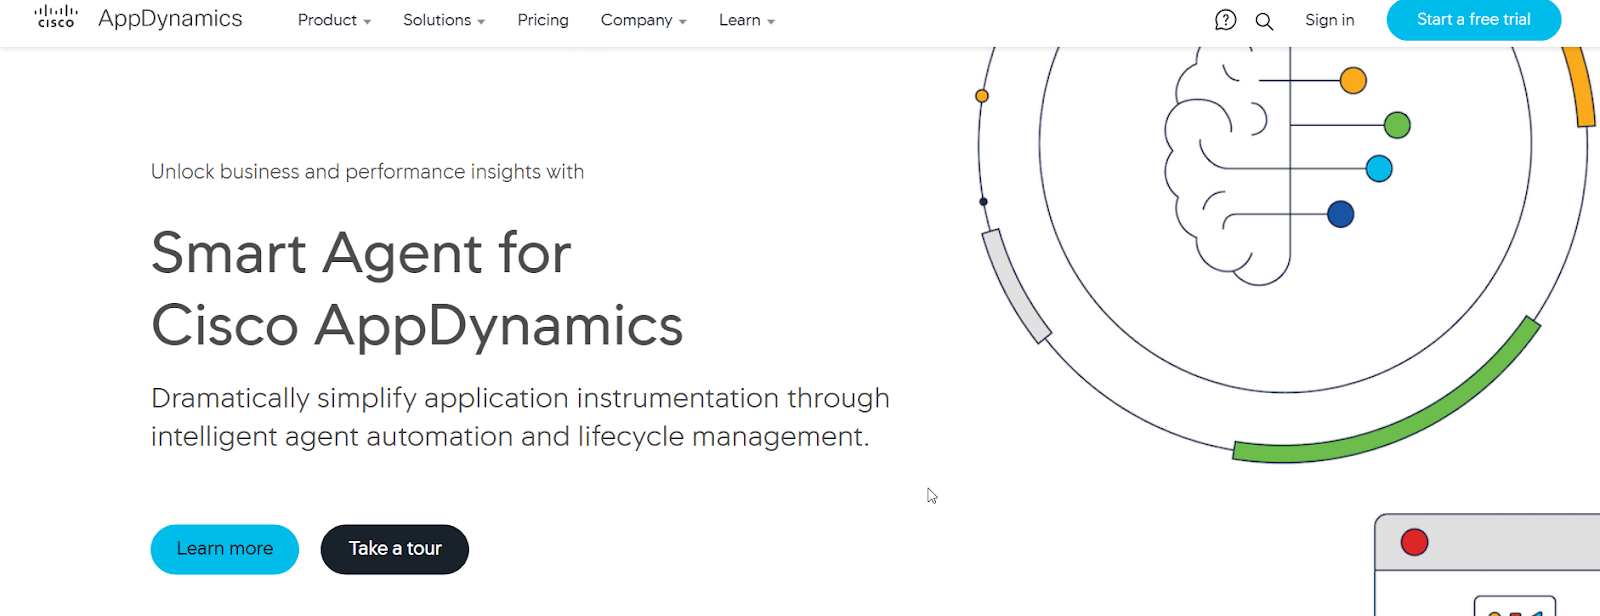
AppDynamics enables the monitoring of CI/CD pipelines by integrating with tools like Jenkins. It provides performance feedback across the SDLC using correlated application and infrastructure monitoring data.
Features:
- Integrates with multiple platforms
- Provides performance insights across application and infrastructure components
- Machine learning-driven root cause diagnostics
- Jenkins
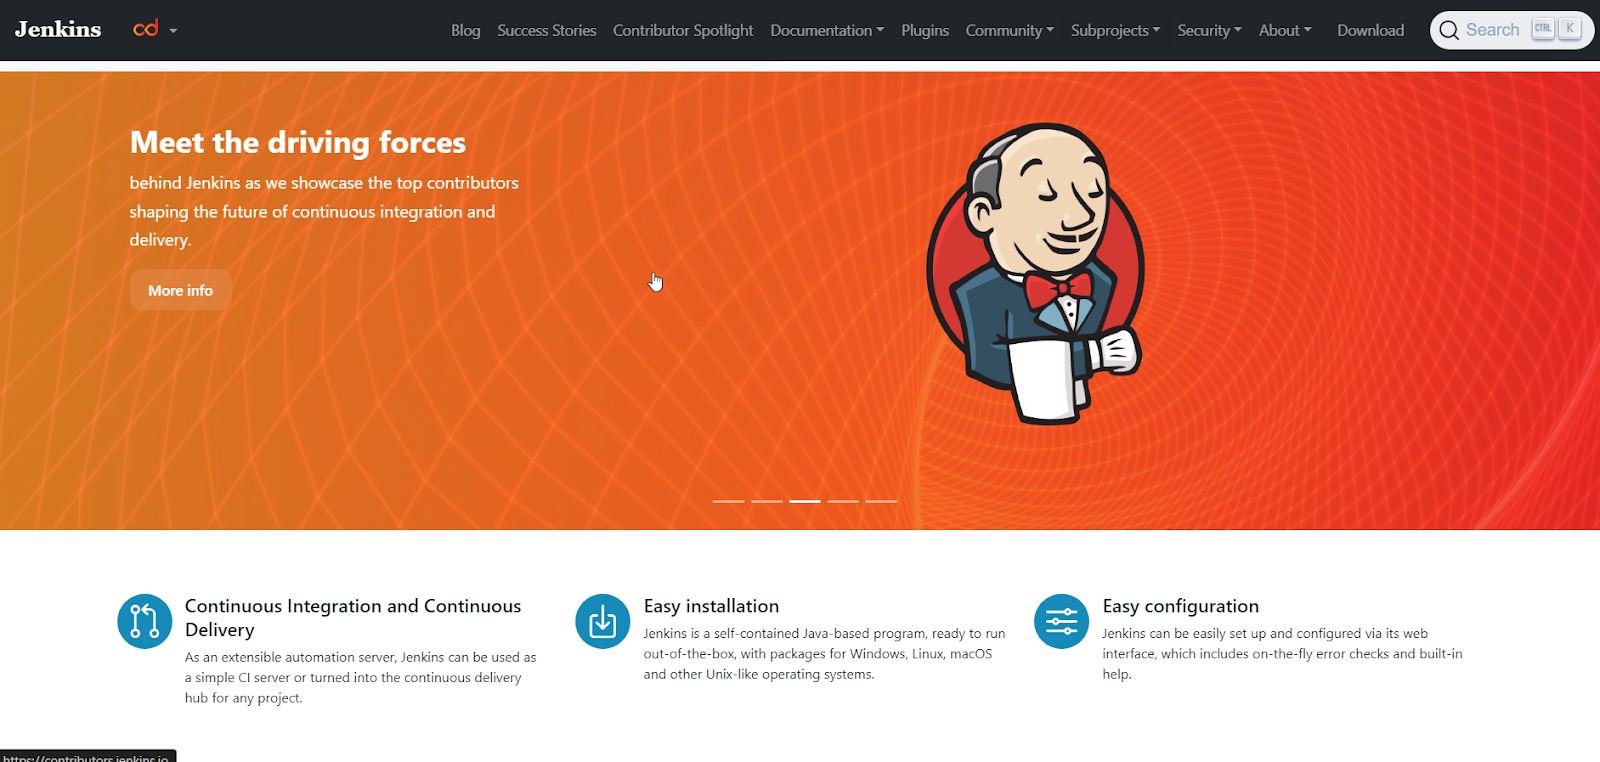
Jenkins itself provides extensive plugins to monitor builds, test reports, code quality, and other pipeline metrics. It can be combined with Prometheus and Grafana for rich visualizations.
Features:
- Supports the creation of complex build pipelines.
- Allows distribution of workload across multiple machines for faster build, test, and deployment processes.
- Seamlessly integrates with numerous DevOps tools.
- Highly configurable to meet diverse needs.
Test Server Monitoring
Test server monitoring tools help evaluate ongoing tests, provide feedback, and ensure tests meet defined benchmarks.
- Selenium
Selenium is a widely used open-source framework for automating web browsers. It supports multiple browsers and operating systems, enabling developers to write scripts in various programming languages, such as Java, C#, and Python.
Features:
- Supports multiple programming languages for test scripts.
- Cross-browser compatibility (Chrome, Firefox, Safari, Edge, etc.)
- Supports parallel test execution to reduce test time.
- Includes Selenium Grid for running tests on different machines and browsers concurrently.
Alarm Aggregation and Incident Management
As monitoring generates alerts from multiple sources, alarm aggregation and incident management tools help DevOps teams streamline and prioritize alerts.
- PagerDuty

PagerDuty is a leading incident management platform that integrates with various monitoring tools to provide alerting, on-call scheduling, escalation policies, and incident resolution.
Features:
- Real-time alerting and incident management.
- Integration with numerous monitoring and ticketing tools.
- On-call scheduling and automated escalations.
- Analytics and reporting to improve response processes.
- Mobile app for managing alerts and incidents on the go.
- Stakeholder communication features to keep everyone informed during incidents.
Best Practices for Implementing Monitoring Tools
Follow these best practices to utilize monitoring tools in a DevOps environment efficiently.
- Define Monitoring Requirements
Clearly define what needs to be monitored - applications, infrastructure, user experience, business metrics, etc. Prioritize based on criticality and align with organizational goals before selecting tools.
- Set Up Monitoring Infrastructure
Architect a scalable and centralized monitoring infrastructure that integrates well across different environments (dev, test, prod) and teams. Containerized and cloud-based deployments can simplify infrastructure setup.
- Configure Alerts and Notifications
Set intelligent thresholds, filters, and policies for alerts based on monitoring data. Route alerts through collaboration channels for rapid response. Implement on-call schedules and escalation processes.
- Implement Dashboards and Visualizations
Build comprehensive dashboards that provide a single pane of glass view across different monitoring data sources - logs, metrics, events, user data, etc. Enable data correlation for deeper insights.
- Foster Collaboration and Observability
Promote knowledge sharing on monitoring practices across teams. Implement role-based access and sharing of monitoring data. Combine multiple telemetry sources to gain holistic observability into the entire system.
Sharpen your DevOps skills through the following learning paths:
Conclusion
A robust monitoring strategy provides the visibility needed to run applications at scale reliably. The tools covered in this guide cater to all aspects of monitoring—from infrastructure to user experiences, business metrics, and much more. Mastering the right set of tools ensures that your team can detect issues early, respond swiftly, and maintain optimal performance across your systems.


Discussion