


Highlights
- docker compose logs displays aggregated logs for multi-container applications.
- Logs can be viewed for all services or a single service.
- Flags like
--tail,--since, and--untilhelp filter log output. - Real-time log streaming simplifies docker compose troubleshooting.
- Time-based filtering is useful for debugging specific incidents.
As you deploy containerized applications using Docker, you may occasionally encounter issues that prevent your applications from running as expected. This is where effective troubleshooting becomes essential, and logs serve as your best tool for this purpose.
Logs are detailed records of the events that occur within an application. They provide valuable insights, including error messages, stack traces, and other relevant contextual information.
In this blog post, we will explore how to use the docker-compose logs command to view logs for a multi-container application deployed via Docker Compose. Further, we'll dive into how to use various flags with this command to filter and manage the output. Let's get started!
Prerequisite
To follow along with the examples in this post, you need a code editor. You also need to have Docker Desktop and Docker Compose installed on your system. Note that Docker Compose is installed as part of Docker Desktop for Windows and macOS. For Linux, follow the instructions on the link: where to get Docker Compose. If you don’t have Docker Desktop, you can download it from this link: Get Docker.
Try the Docker Compose Labs for free

Start an App With Docker Compose
Before we can view the log output, we need to launch a multi-container application. For this blog post, we'll use a sample Compose app from Docker's official GitHub repository called "awesome-compose". This repository houses a collection of sample Compose applications written in various programming languages.
We're going to work with a Python/Flask application that utilizes a Redis database. This application resides in a directory named flask-redis within the awesome-compose directory. Upon starting, the Flask application and the Redis database each run in their separate container. Eventually, we'll have a two-container app running on Docker.
Start by running the following command to clone the awesome-compose repo to your local machine:
git clone https://github.com/docker/awesome-compose.gitAfter cloning the repo, navigate into the flask-redis directory. Then, run the ls command to list the files inside that directory. Here's what you should see:

Here’s a brief explanation of the key files:
app.py: Contains the application code.compose.yaml: Describes how Docker should build and deploy the app. It features two services under theservicessection:redisandweb. Also, note that port 8000 in the host machine is mapped to port 8000 on thewebcontainer.Dockerfile: Describes how to build the image for thewebservice.
Feel free to examine these files. Now, with a basic understanding of the app's structure, let's bring the app up using Docker Compose. Run the following command:
docker-compose up -dHere, the -d flag ensures that the app runs in the background.
Running the command above will generate an output similar to this:
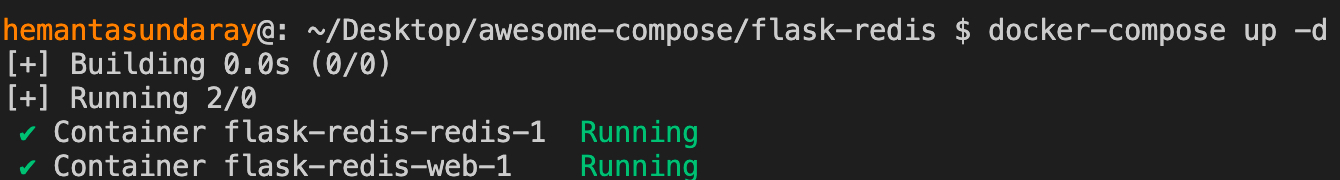
Note: If you're running this command for the first time, the output will be more verbose and different from the one shown above. The application startup will also take a bit longer. The output shown above is brief because I had previously started the application using docker-compose up -d and this is the second run.
Next, let’s list the containers in our Compose app and their statuses by running the following command:
docker-compose psAfter running the command above, you should see an output similar to this:
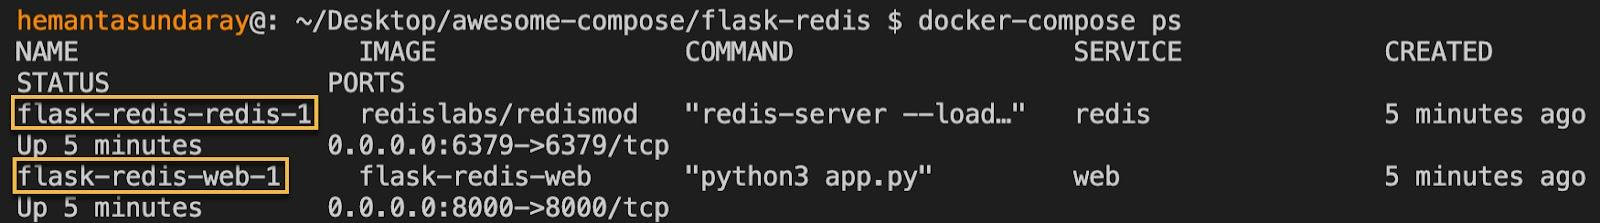
As highlighted above, the two containers are up and running. Notice how the container names are prefixed with a project name, which by default, is the name of the directory (in our case, "flask-redis") that contains the compose.yaml file. The number 1 means this is the first instance of that service.
Now that we have the containers up and running, let’s explore how to view their log output.
View Logs of All Running Containers
To view the logs of all running containers at once, run the following command:
docker-compose logsRunning the command above will display an output similar to this:
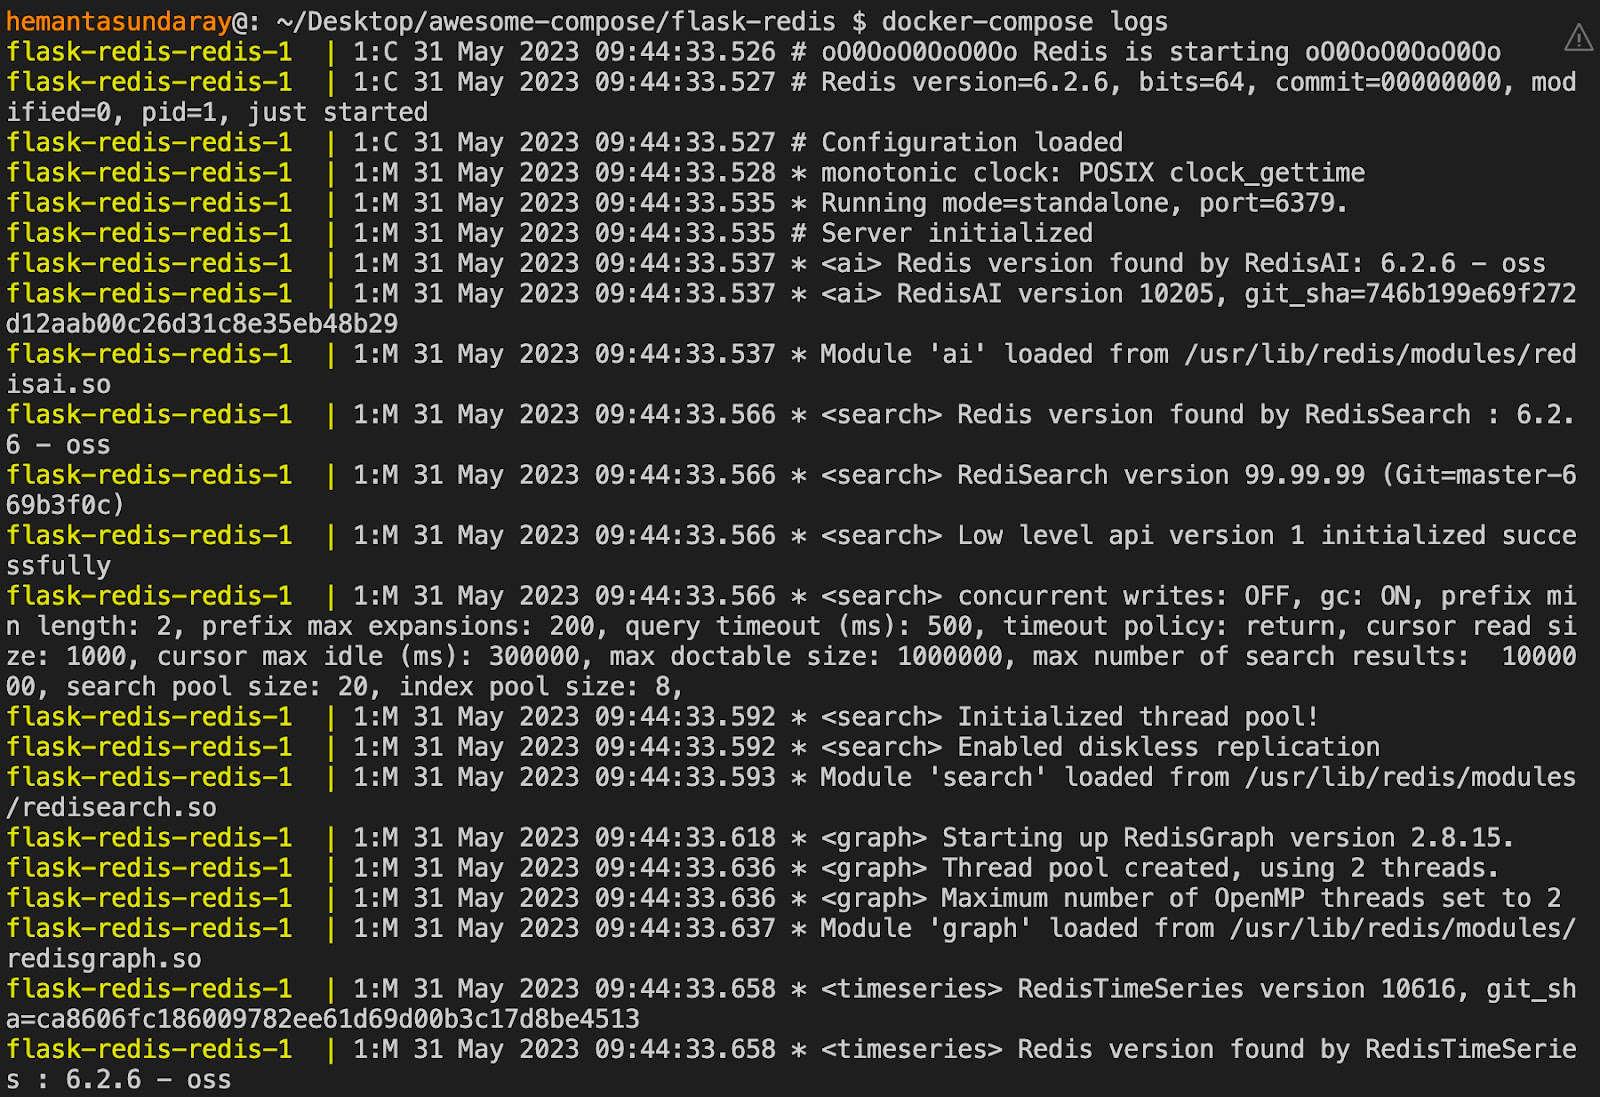
The screenshot above represents a partial output. If you scroll down, you should also see the logs generated by the web service, as shown below:
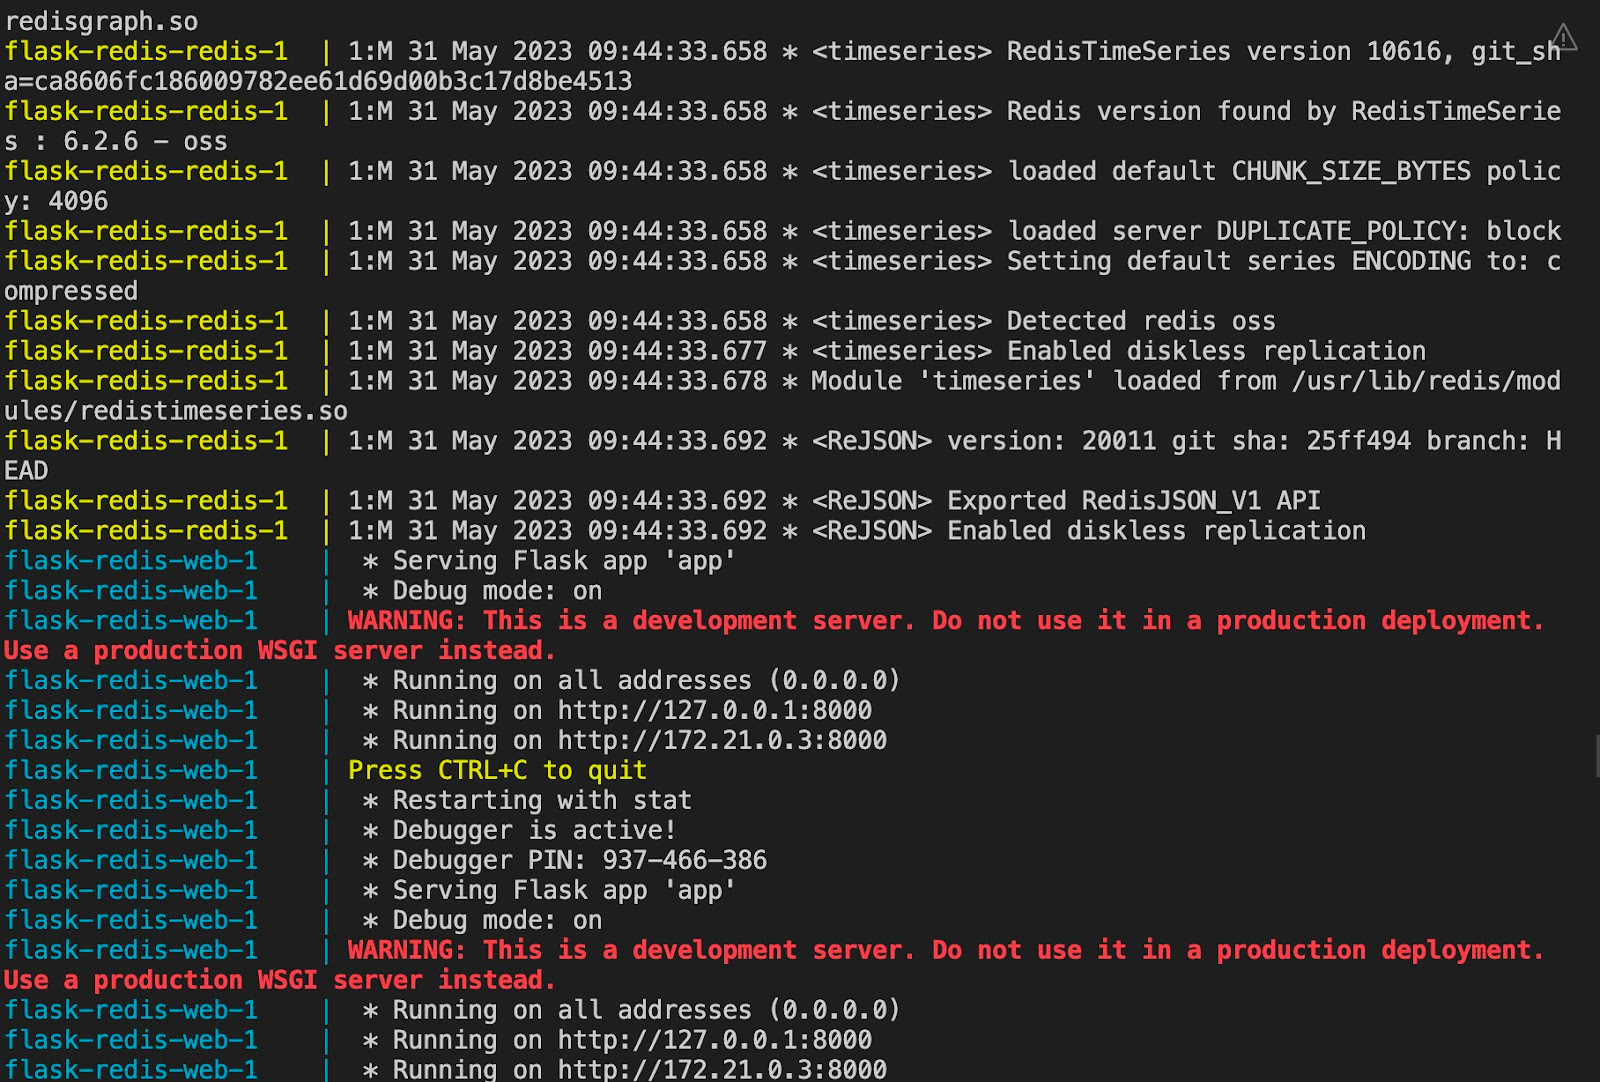
Notice how the logs are color-coded based on the container names. This makes it easier to identify the source of each log.
View Logs of a Specific Service
To view the logs of a specific service, simply specify the service name after the docker-compose logs command. The syntax is as follows:
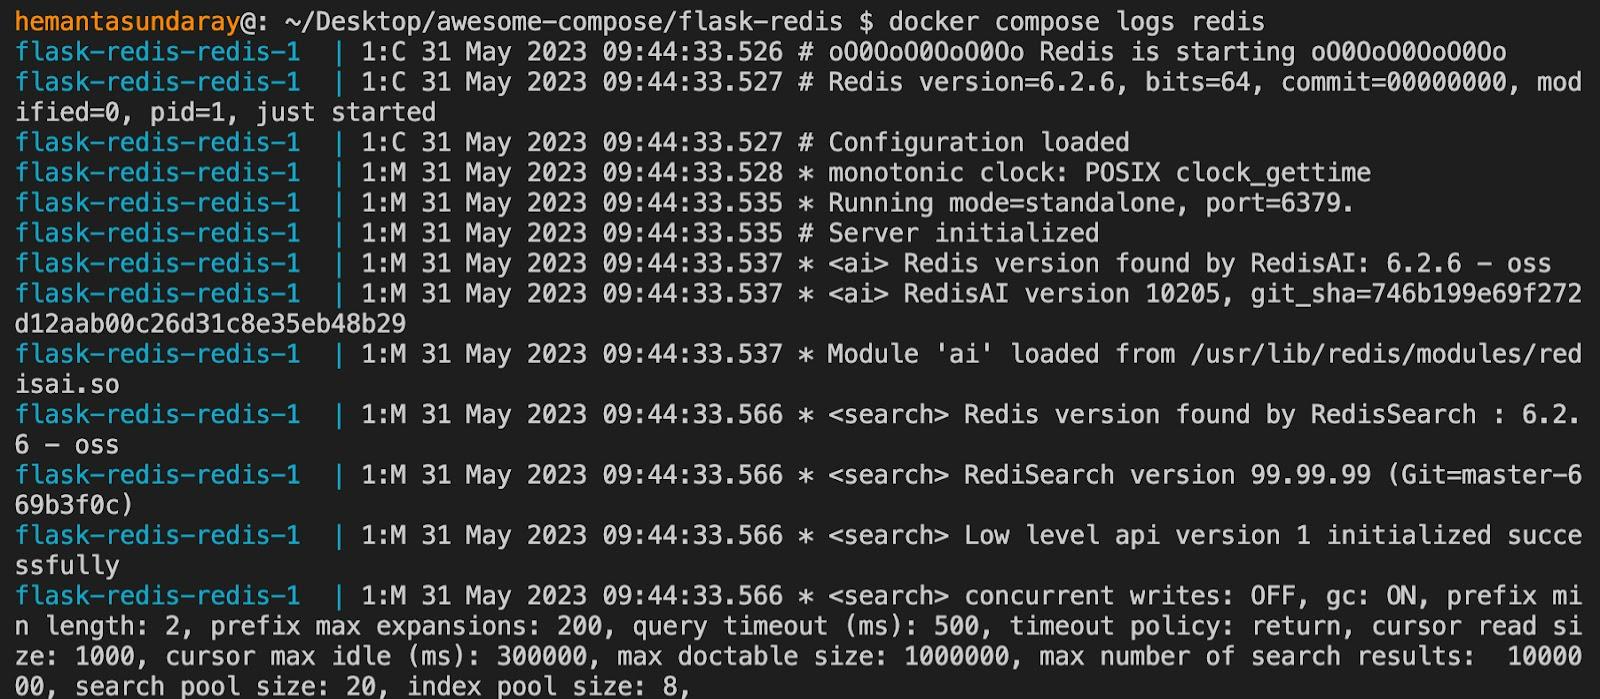
docker-compose logs <SERVICE-NAME>For example, if you want to view the logs of the redis service, run the following command:
docker-compose logs redisRunning the command above will display an output similar to this:
View a Specific Number of Lines From the End of Logs
Sometimes, you might only be interested in the most recent entries in the log. In such cases, the docker-compose logs command comes with a --tail flag designed specifically for this purpose.
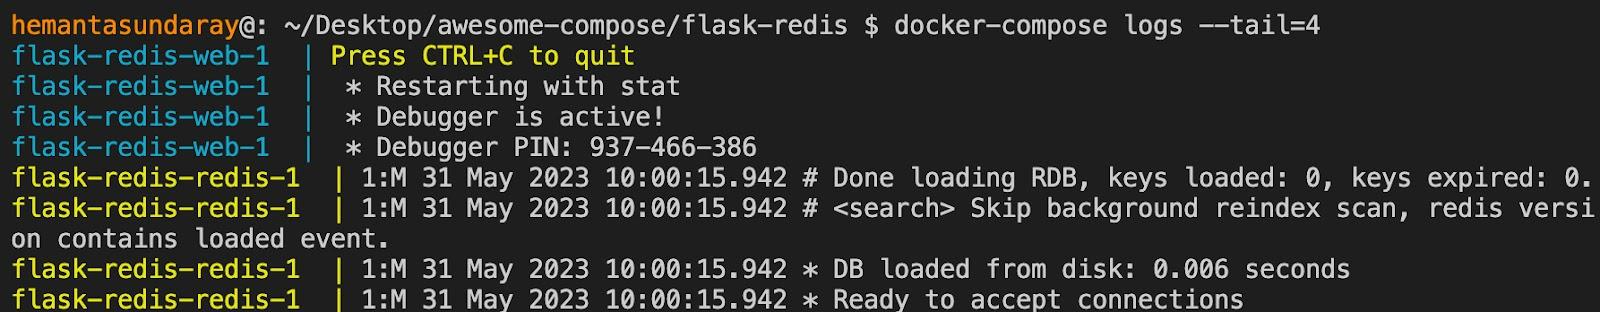
For instance, to retrieve the four most recent lines of the log from all running containers, run the following command:
docker logs --tail=4Upon running the command, you should see an output similar to this:
View Logs in Real-time
We can continuously watch the log output in real-time by passing the -f (short for "--follow") flag to the docker-compose logs command. Run the following command to stream the logs:
docker-compose logs -f --tail=4Here, we have used the --tail flag to limit the log output.
Running the command above will show you an output similar to this:
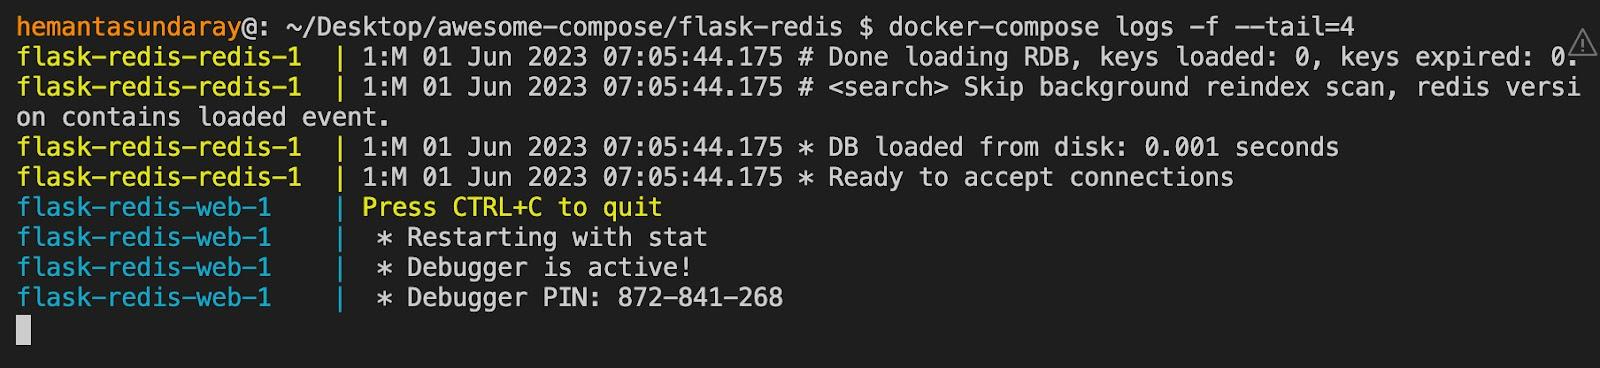
As you can see, the command is active and will print new log entries as they occur.
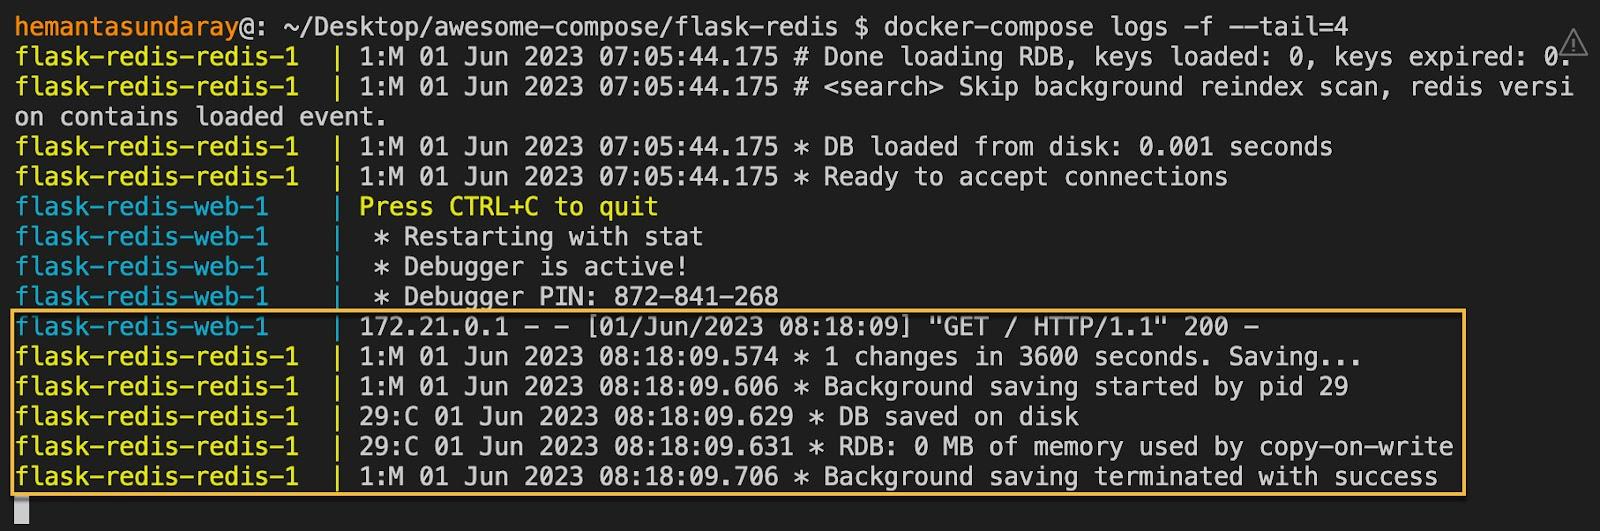
Next, open a new terminal tab and run the following command to send a GET request to our app:
curl localhost:8000Running the command above will display the following output:

Now switch back to the first tab. You should see new log entries added to the log output, as highlighted below:
Before we move on to the next section, press ctrl+c to stop following the logs and return to your terminal.
View Logs Generated Before and After a Specific Time Period
To filter logs based on time, we can use two flags with the docker-compose logs command: --since and --until.
The --since flag is used to view the logs that were generated after a specified time period. In contrast, --until flag is used to view the logs that were produced before a specified time period.
Both of these flags accept relative time periods (like "5m" for 5 minutes, "1h" for one hour, etc.) or timestamps in the following format:
YYYY-MM–DDTHH:MM:SSWhere:
- YYYY represents the year
- MM represents the month
- DD represents the day
- T is a separator indicating the start of the time portion
- HH represents the hour
- MM represents the minute
- SS represents the second
Using the --since flag
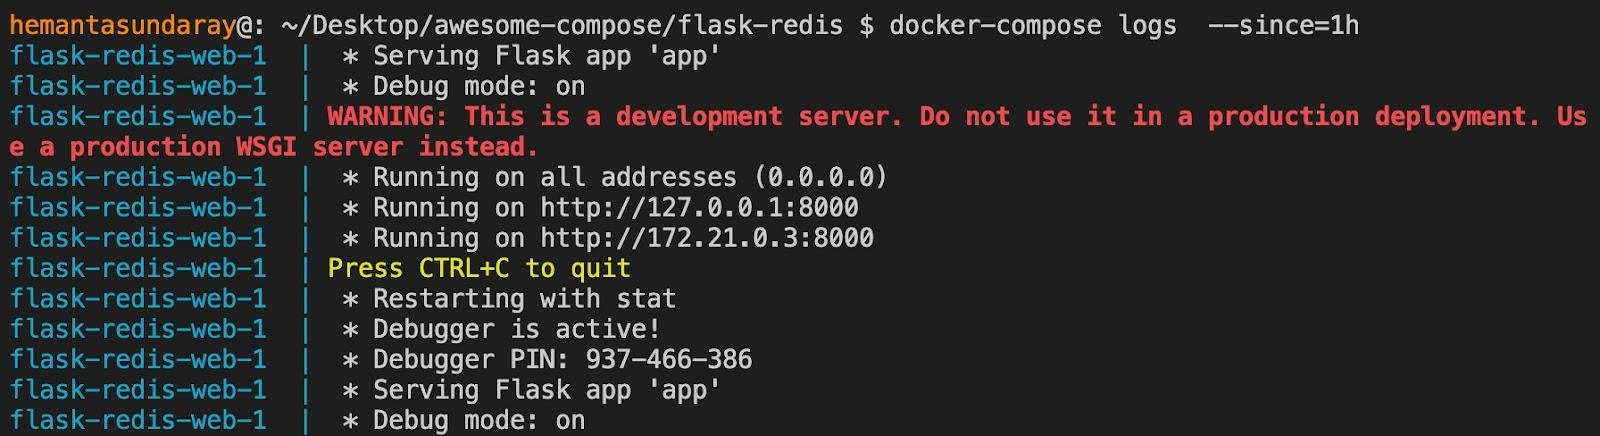
To view the logs generated within the last hour, run the following command:
docker-compose logs --since=1hRunning the command above should produce an output similar to this:
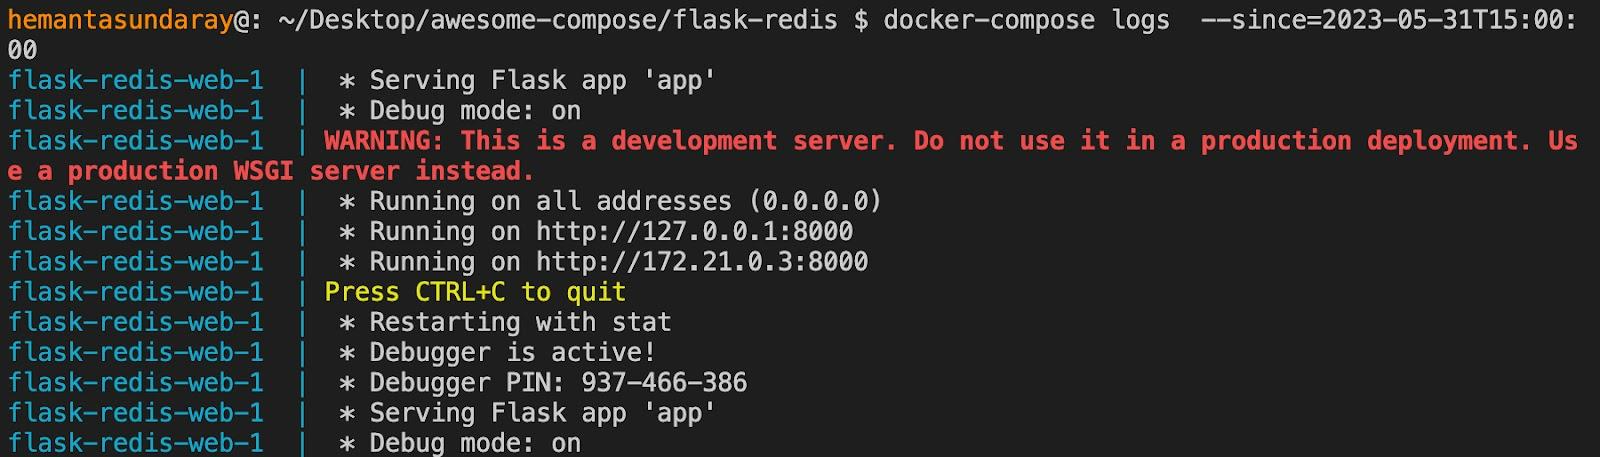
We can also pass timestamps to the --since flag. For instance:
docker-compose logs --since=2023-05-31T15:00:00Running the command will produce an output similar to this:
Using the --until flag
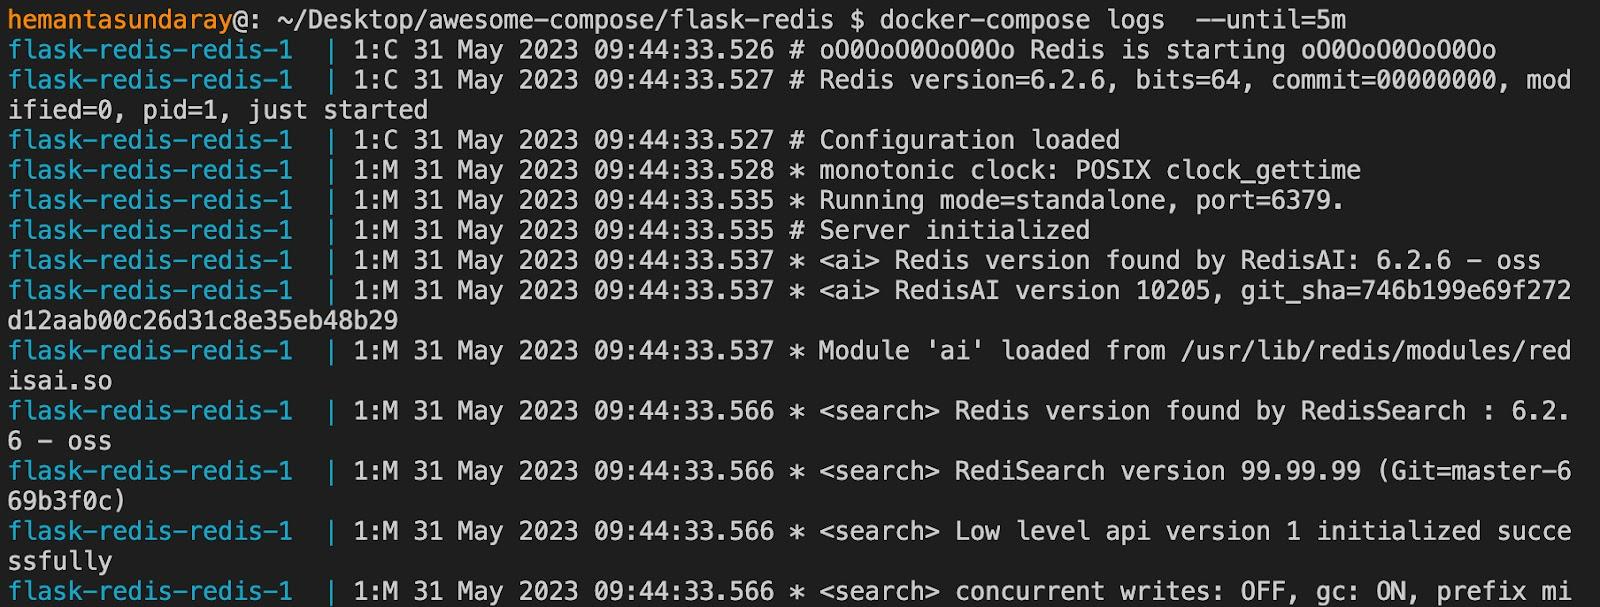
To view the logs generated until five minutes ago, run the following command:
docker-compose logs --until=5mRunning this command will produce an output similar to this:
We can also use a timestamp. For instance, to see the logs generated until 4 P.M. on May 31st, run the following command:
docker-compose logs –until=2023-05-31T16:00:00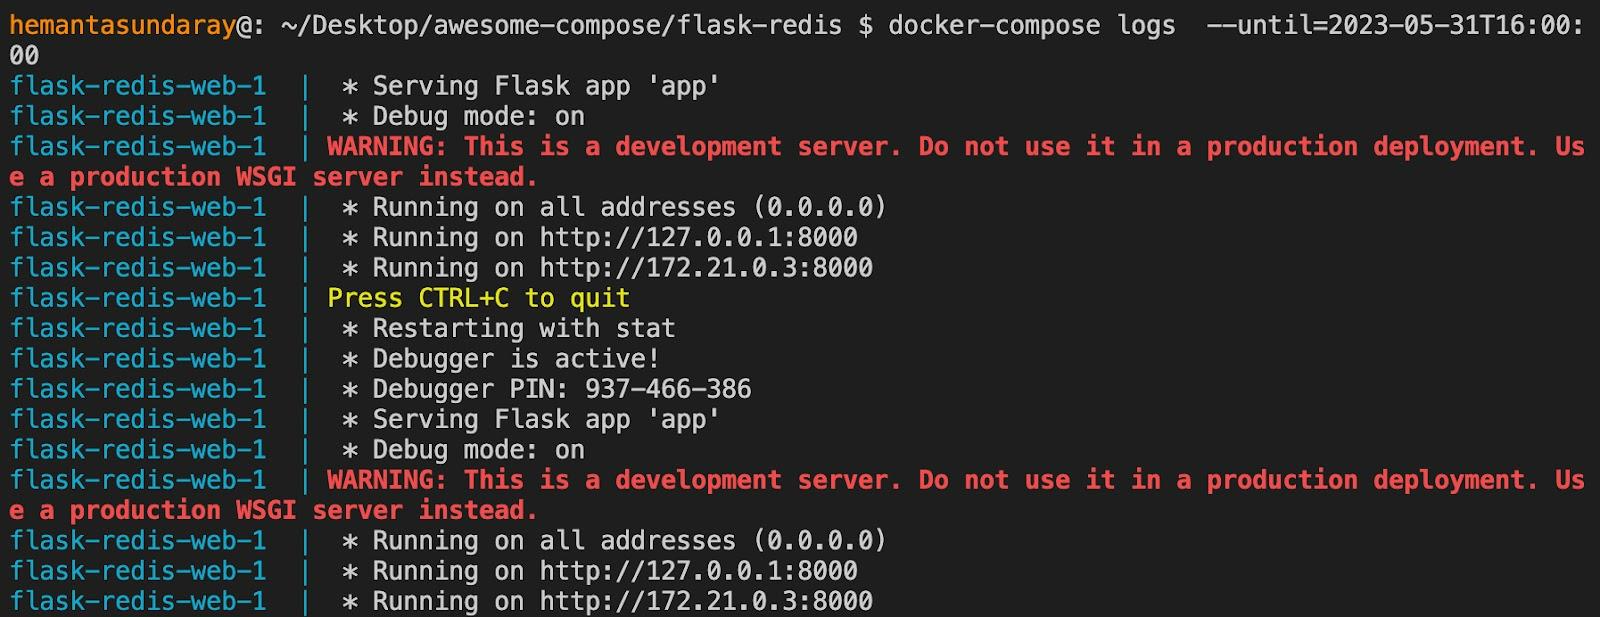
Using --since and --until flags together
We can also combine both --since and --until flags. This is particularly useful when you want to view logs generated between two specific time periods.
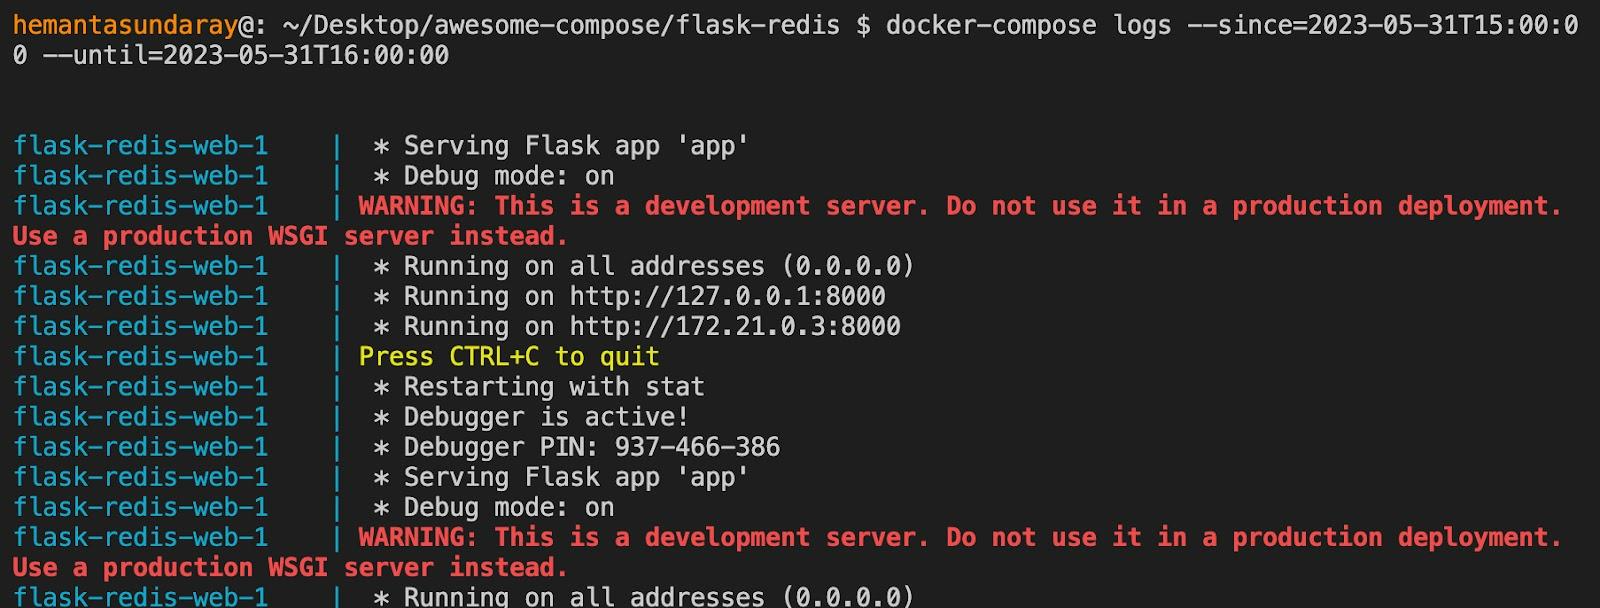
For example, to view logs that occurred between 3 P.M. and 4 P.M on May 31st, run the following command:
docker-compose logs –since=2023-05-31T15:00:00
–until=2023-05-31T16:00:00
Running the command above will produce an output similar to this:
Master containerization with our Docker Learning path:

Conclusion
In this blog post, you learned how to use the docker-compose logs command to view logs for a multi-container application deployed using Docker Compose. You also learned how to use various flags with this command to customize the log output.
More on Docker:
- How to Keep Docker Container Running
- How to Clear Docker Logs for a Container
- How to Build a Docker Image With Dockerfile From Scratch
- How to Pass Environment Variables to Docker Containers
- How to Use Docker CP Command With Examples
- How to Tag a Docker Image
- How to Create Docker Image From a Container
- How to Remove Unused and Dangling Docker Images
FAQs
Q1: What does docker compose logs do?
It displays logs from all services defined in a Docker Compose project.
Q2: Can I view logs for a single container?
Yes. Specify the service name after the command.
Q3: How do I follow logs in real time?
Use the -f flag to stream logs continuously.
Q4: Does docker compose logs replace docker logs container commands?
docker compose logs is optimized for multi-container applications, while docker logs targets individual containers.
Q5: Can I filter logs by time?
Yes. Use --since and --until to narrow log output.
Q6: Is docker compose logs useful for debugging production issues?
Yes. It is a core tool for docker debugging and root cause analysis.


Discussion