


DevOps metrics provide a way to track progress toward continuous improvement of velocity, quality, and application performance. Without the metrics, it becomes more difficult to make data-driven decisions in a timely and reliable manner.
In this guide, we’ll briefly discuss the benefits of calculating DevOps metrics. Then, we’ll explore DORA metrics and what to keep in mind when reaching a conclusion using them.
Why Monitor DevOps Metrics?
Monitoring DevOps metrics enables you to do the following:
- Analyze long-term trends using observability data
- Set up useful alerts with high signal and low noise
- Build useful dashboards that help with planning and reporting
- Generate realistic SLAs, SLOs, and SLIs
- Build up an internal bank of software engineering best practices
Being ‘data-driven’ is nice, but there's a danger of drowning in metrics. You only need a few metrics to prove value.
Check out the 17 DevOps Monitoring Tools to Learn in 2024.
4 DevOps Metrics to Track
The DevOps Research and Assessment (DORA) team at Google identifies four key metrics that measure DevOps performance, split into velocity metrics (DF and CLT) and stability metrics (MTTR and CFR):
- Deployment frequency (DF)
- Change Lead Time (CLT)
- Mean Time to Recovery (MTTR)
- Change Failure Rate (CFR)
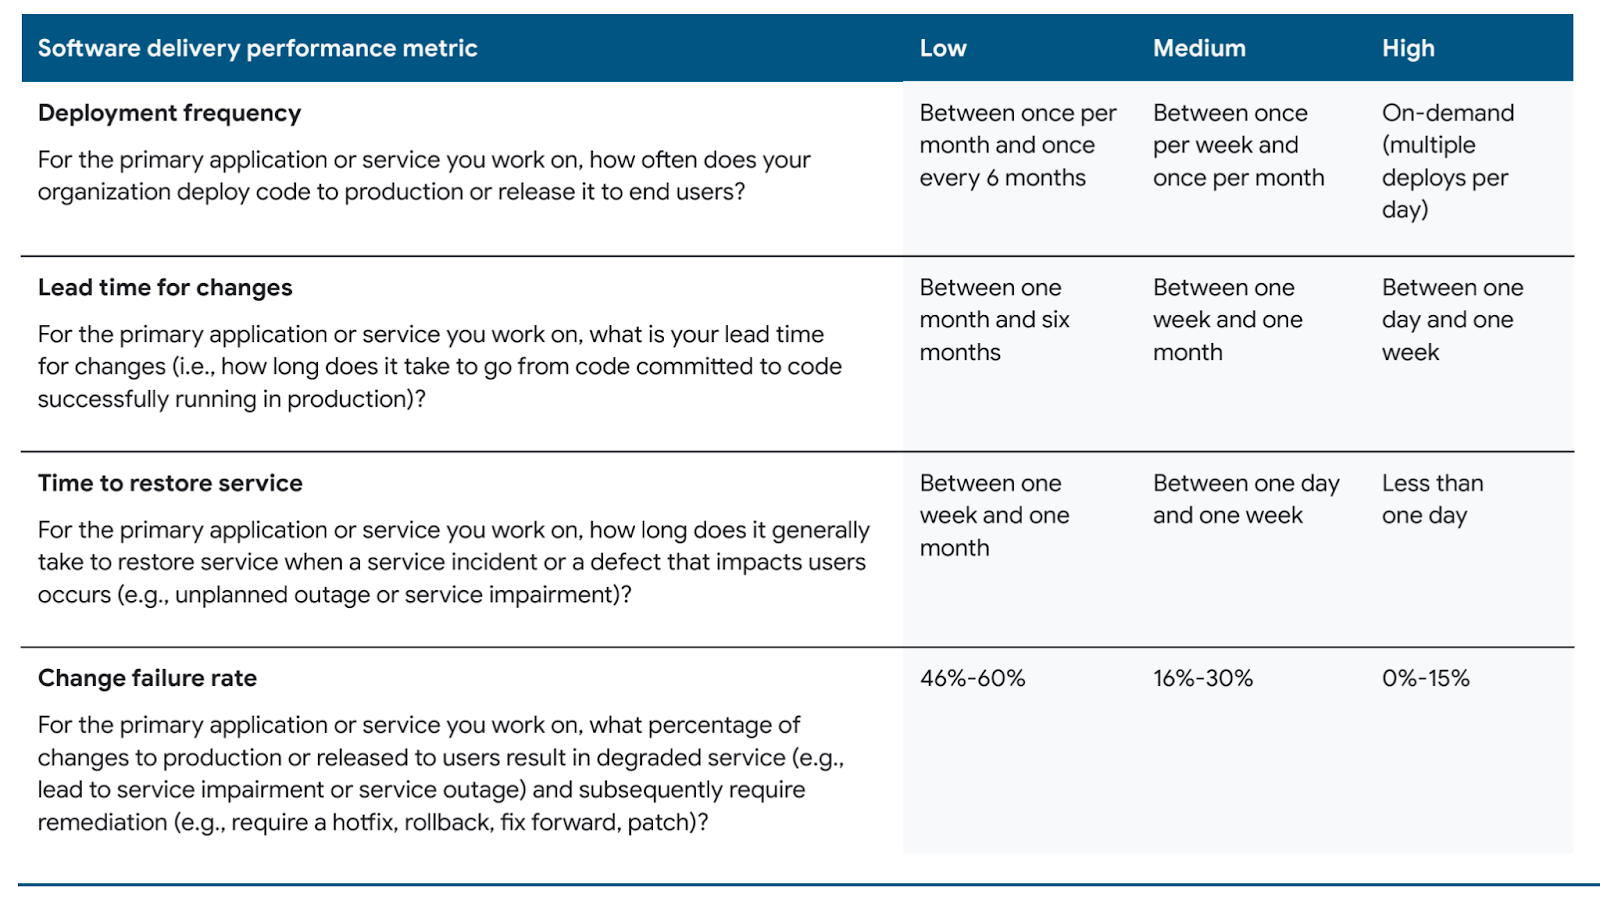
Below is how most teams perform across these metrics.
High-performing teams deploy more often, with shorter lead times for changes, fewer failures, and faster service restorations. Low-performing teams do the opposite, leading to inefficiencies and bad user experiences.
Let’s explore each metric in more detail.
- Deployment Frequency
Deployment frequency measures how frequently code changes are pushed to staging or production. It can be a direct or indirect measure of DevOps team efficiency, response time, developer capabilities, team cohesiveness, and tool effectiveness.
High-performing teams can deploy changes on demand and often do so many times a day. Low-performing teams, on the other hand, are often limited to deploying weekly or monthly.
The calculation of deployment frequency varies from company to company. For example, you may want to calculate deployment frequency for successful pipeline runs. However, how you define ‘deployment’ can also vary the measurement.
If you deploy every small Pull Request or code change, you’ll record a high frequency. If, on the other hand, your deployment is scheduled to run after a specified period, things start to look a little different.
While going from, say, weekly to daily deployments shows how continuous deployment can improve your development process, taking this DevOps metric in isolation can result in inaccurate conclusions.
For instance, if you went from three deployments per day last quarter to 3.3 deployments per day this quarter, you’ve technically become 10% more ‘successful’ — but that’s not a meaningful measure of success. You’d need to weigh in other metrics to determine overall progress.
- Change Lead Time
Change lead time measures how long it takes a code change to go from committed to deployed. It’s basically asking: “How fast can we change a line of code and have it running in production?”
A high-performing team typically measures its mean lead time in hours, while a medium or low-performing team measures its mean lead time in days, weeks, or even months. If the lead time for changes is too long, there are performance bottlenecks somewhere in your software development or deployment process.
Decreasing the change lead time makes you more capable of reacting to changing requirements. You can reduce change lead times with test automation, working in small batches, and trunk-based development.
You calculate change lead time by looking at the average difference between pull request creation times and when they’re merged to the master branch. So, if you had 10 changes in a month with total days from commit to deployment being 90 days for all changes combined, your average lead time for changes would be 90 divided by 10, resulting in an average lead time of 9 days per change.
Of course, identifying needs and opportunities in the product may take months, but committing the code itself might only take a few days. So, while the lead time for changes is a useful metric, it’s shortsighted when used on its own.
- MTTR (Mean Time to Recovery)
Your mean time to recovery measures how fast service interruptions or total failures are identified and resolved.
High-performing teams recover from system failures quickly — usually in under an hour — while low-performing teams may take up to a week to recover from a failure.
You get your MTTR by calculating the average time it takes a bug to be closed as fixed. Automated testing, monitoring, and good incident response can all affect this metric.
In recent years, MTTR’s usefulness has been challenged repeatedly, as statistical design can skew meanness one way or another. Averages can also be misleading and hide the true behavior of systems. So, while you shouldn’t dismiss the metric entirely, try to view it in tandem with other metrics.
- Change Failure Rate
Change failure rate measures the percentage of code changes or deployments that need hotfixes after production. Basically, “How often is a change you made actually 'successful’?”
The cost or impact of a bug grows as it moves further into the pipeline, from failing a pre-commit unit test to causing a production outage. A failure at each pipeline stage means every stage before it failed to find the issue, making the metric even harder to measure.
Broadly speaking, we can define failure as an error or issue that cause problems for customers after a deployment to production. This key metric doesn’t include failures caught by testing that are fixed before deployment.
High-performing teams have change failure rates under 15 percent, while low-performing teams can experience failure rates as high as 60%.
The same things that shorten lead times — working in small batches, automated testing, and trunk-based development — can also reduce change failure rates.
Measure your DORA metrics together (plus Visma’s case study)
The DORA metrics work together. If you just optimize one, you could harm the others and impact the project.
The more often you deploy by implementing automation, the easier it gets to upgrade and roll back. This is because the deployment frequency influences the change failure rate and change lead time. The change failure rate drops since you start automating parts of the deployment, increasing the chances of catching bugs early.
The change lead time drops, too, because you don't accumulate too many changes at once, which has a larger risk of failure. Mean time to recovery also drops since your changes are smaller and easier to debug. Plus, the parts that help to automate your deployments also help with rollbacks.
These 4 metrics are also an indicator of DevOps team health, not just product health. Sustained optimization across all four metrics means the team is working well together to build a better product.
Visma’s now CTO, Alexander Lystad, once shared how his company approaches DevOps and tracking:
“We are tracking delivery lead time, deployment frequency, change failure rate, mean time to restore, and availability across 65+ teams and growing.
We ask teams to automatically register an SDOP Deployment issue in Jira for every deployment to Production. We ask that they include the number of changes and the total delivery lead time for all changes included in the deployment.
When teams experience an incident, we ask them to register a SDOP Incident in Jira that includes when the unavailability started and ended.
Similarly, when teams make a manual change to the system (i.e. not through an automated delivery pipeline) we ask them to register a SDOP Change issue in Jira that includes any unavailability that has occurred.
Then we make all the data available in Tableau reports.”
You can watch Alex’s video explaining it below:
[embed] https://www.youtube.com/watch?v=neT2P81JKXM [/embed]
Note: When you implement these principles, things will start looking worse before they look better. You may start to doubt if they’re working, but that’s when you should stay the course.
Clarify Your Context
Measuring DORA metrics isn't quite as simple as many make it seem. The same definition won't apply to all teams across an organization. There's also no unified definition of DORA metrics across many off-the-shelf tools.
Therefore, don’t merely return from a DevOps conference and, after learning that "Company X does it this way!" try to implement things their way. Try to understand why the choices were made and how you might approach the same problems in an organization with different resources.
For example:
- Your company might be going through a period of rapid and continuous change. It’s hard to determine benchmarks when everything changes weekly.
- You don’t get enough major incidents in a given period to collect data. There's no way to calculate a DORA metric meaningfully from tiny sample sizes.
- You use a different metric in your workflow (e.g., You don’t experience major outages but make constant changes to production and raise escalated tickets on high-priority defects). You might focus on the wrong metrics (e.g., MTTR) instead of the right ones (e.g., how long it takes to solve escalated tickets).
Tailor the DevOps metrics you track to your unique situation.
Tips to Measure DevOps Metrics
The tips below will help you maximize the value you get from DevOps metrics:
- Set baselines: You have to know your starting line before you can really track progress or celebrate wins. It’s like checking the scoreboard before the game kicks off.
- Don’t turn measures into targets: Goodhart’s Law states that "When a measure becomes a target, it ceases to be a good measure." When you obsess over one number, you might lose sight of what matters to your DevOps success.
- Start small: Being able to add new features quickly keeps you ahead of the competition. Make smaller, more manageable batches of changes or deployments. Smaller changes are easier to grasp, move more quickly through the deployment pipeline, and are simpler to roll back. Recoveries from failures are also faster.
- Beware simplicity: It’s tempting to rally around one easy-to-grasp metric, but the truth is, no single number tells the whole story. DevOps is a journey and a mindset around software development — not just a number.
- Make fair comparisons: If you’re looking at metrics from two different projects or even two different times, measurements may not perfectly line up. Context is key, and scenarios differ.
- Dig a bit deeper: Don't just pick the low-hanging fruit - it's easy to measure what's in front of you - go for metrics that really spell out value for your team and your projects, even if they take a bit more effort to track.
- Check customer feedback: Even if you're deploying without problems, users might still have issues. DORA metrics don't tell you about user satisfaction. See what users are saying to know what needs fixing. This is all part of value stream management.
- Decide who handles problems: It's not just about how many issues you have but if you have enough people to fix them. If you're tracking issues but don't have the staff to fix them, that's a problem.
- Look for patterns in issues: Are the same kinds of problems happening over and over? This can show you bigger issues that need fixing.
- Watch for close calls: Not just the problems that happened, but the ones that almost did. They can teach you a lot about how to avoid future issues in software delivery.
- Track cost savings: Show how DevOps is making things cheaper or avoiding extra costs. This justifies its budget.
- Keep downtime low: You want your system working all the time because downtime causes revenue loss and can tarnish your organization’s reputation. Do everything within your power to avoid it.
- Cut down on manual work: Too many checklists or documentation can slow down the DevOps process. Try using things like automated tests to speed up software deployment.
How to Interpret DevOps Metrics
DevOps metrics require you to be savvy with the stats you gather. It's easy to be misled by averages if you're not careful.
When Elon Musk walks into a room, the average wealth rises, and everyone seems richer on paper, but not much has changed for anyone but Musk. Relying solely on averages to make decisions can hide the true distribution of data, like how one outlier can skew perceptions.
Consider excluding the outliers in your data. These are the extreme values that can distort your understanding of the average performance. For instance, if one deployment takes significantly longer than the others due to unforeseen issues, it shouldn't set the standard for your typical deployment time.
Bucketing data can also help. This involves grouping similar types of data together to analyze trends within those groups. For example, separate new feature deployments from bug fixes when calculating lead times. This helps you see if one type consistently takes longer than the other and why.
Lastly, always question what your data is showing you. Ask yourself: What story is the data telling? What might it be leaving out? For instance, if your change failure rate suddenly improves, is it because your deployments are truly more stable, or are you deploying less frequently and thus reducing the opportunity for failure?
Spend more time improving the product itself
Putting more effort into the early stages of your product's development means you're less likely to run into trouble when you deploy. Think of it as fixing leaks in a boat while it's still in the dock rather than when you're out at sea. This proactive approach saves time and ensures your product is robust and user-ready quicker.
However, understand that not all aspects of your product's performance can be directly influenced by your DevOps team. DORA metrics, valuable as they are, sometimes reflect factors beyond your immediate control, such as overarching business processes or decision-making timelines. For example, if your company has a policy that requires extensive security checks before deployment, it will naturally extend your lead times.
Recognizing the boundaries of what you can directly impact helps set realistic goals. For instance, while you might not be able to speed up those company-mandated security checks, you can work on streamlining other parts of your deployment process to compensate for the lost time.
Measure DevOps Metrics Better
DORA provides a useful framework to improve how you build and operate tech services, especially if you’re considering a migration to Kubernetes.
But it must be tailored to your context, used in tandem with other metrics, viewed as a single point in time, and not gamed.
The high-level goal of these key DevOps metrics is to figure out how well the pipeline is working and see where to make improvements.
Training Helps
KodeKloud offers a variety of courses tailored to enhance your team's skills in key areas, resulting in improved DevOps metrics.
From Kubernetes and Docker to AWS and Azure, our courses cover everything you need for better deployment frequency, quicker mean time to recovery, and lower change failure rates.
The hands-on approach of the courses ensures your team can apply new skills directly to your projects, improving both velocity and stability.
Browse our KodeKloud's courses page for more information.


Discussion