


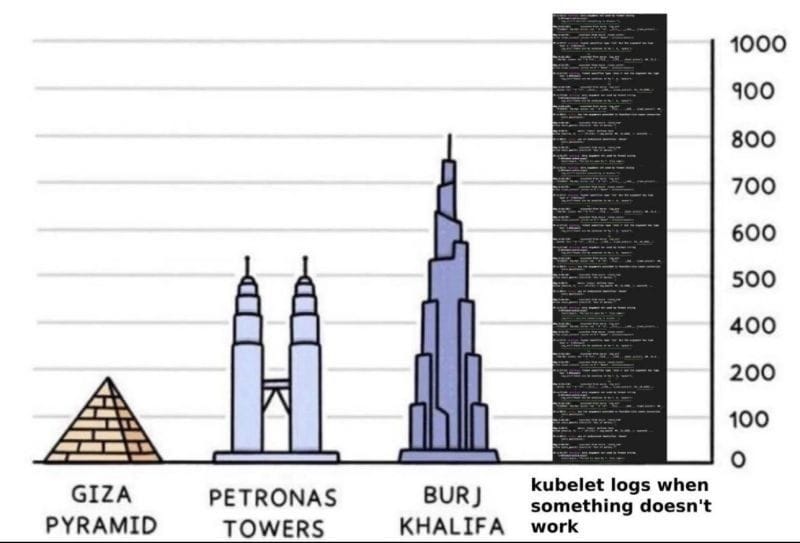
You might have seen this meme, which humorously shows how overwhelming Kubelet logs can be when something goes wrong. While it’s funny to see how long these logs are, they can really be very complicated. However, this mountain of information is very useful and can help you fix issues in your Kubernetes cluster if you understand it well. This guide will be a starting point for you to understand these long logs, giving you tips and tricks to navigate them easily.
What is Kubelet?
Before diving into Kubelet logs, let's understand what Kubelet is and what it does. Kubelet runs on every node in a Kubernetes cluster.
Nodes are the individual computers or servers that run your applications. There are two types of nodes: control plane nodes, which manage the overall cluster, and worker nodes, or just nodes, which run the application workloads.
Kubelet communicates with the control plane. The control plane makes decisions about the cluster, like scheduling workloads, and stores the cluster state. Kubelet receives instructions from the control plane and reports back on the status of the node and its Pods.
Kubelet's main job is to ensure that containers are running in Pods.
A Pod is the smallest, most basic unit in Kubernetes, representing a single instance of an application.
Kubelet constantly monitors the health of the node and its Pods. It performs regular checks and reports any issues to the control plane. If a Pod or node is not healthy, Kubelet tries to restart the Pod or take other corrective actions.
Additionally, Kubelet reads the Pod specifications from the control plane and ensures that the correct containers are running with the specified configurations. It also updates the running Pods if there are any changes in the configuration.
If you want to know more about how the Kubernetes architectural components work, check KodeKloud's video.
Understanding Kubelet Logs
Kubelet logs are the records created by the Kubelet agent running on each node in a Kubernetes cluster. These logs are essential for diagnosing issues and ensuring that containers are running smoothly in their Pods. However, they can be quite detailed and complex, making them challenging to navigate.
Why We Need Kubelet Logs?
Kubelet logs are crucial for several reasons. They help in diagnosing issues by identifying and resolving problems within your Kubernetes cluster. By understanding these logs, you can monitor the performance of your applications, ensuring they run smoothly.
Logs also play an important role in security auditing by tracking access and actions within the cluster, which helps maintain security. Additionally, keeping detailed records of system activities is essential for meeting regulatory compliance requirements. This historical data ensures that you have a clear record of what has happened in your cluster over time.
Why Are Kubelet Logs So Lengthy?
Remember the meme I showed at the start of this post, comparing Kubelet logs to huge structures like the Giza Pyramid, Petronas Towers, or even the Burj Khalifa? It’s funny but true—these logs can feel overwhelming because they record everything that happens in a node.
Let’s see why these logs are so long:
- Container Start-Up and Shut-Down Events: Every time a container starts or stops, it gets logged. This helps you track what’s happening with your containers and understand any issues.
- Health Checks: Kubelet regularly checks the health of the containers and nodes. These checks are logged, helping you see when something goes wrong and why.
- Node Status Updates: Kubelet logs the status of each node, like whether it’s ready to run pods or if there are any problems. These updates give a detailed view of the node’s health over time.
- Interaction with the API Server: Kubelet talks to the Kubernetes API server to get instructions and report back. These interactions are logged to help you understand the communication flow and spot any issues.
- Errors and Warnings: Any errors or warnings Kubelet encounters are logged. These messages are crucial for fixing problems and keeping your cluster running smoothly.
So, next time you feel like you’re facing a log tower taller than the Burj Khalifa, remember that each log entry is a piece of the puzzle to help you manage and fix your Kubernetes cluster.
Do We Have a Way to See All These Kubelet Logs?
Answer is yes.
But before diving into the hands-on practical, it's important to understand how to access the logs generated by Kubelet. One of the most effective tools for this purpose is the journalctl command.
Do You Know About the Systemd Journal?
Have you ever heard about the systemd journal in your DevOps or cloud career? The systemd journal is a component of the systemd suite, which is used for system and service management in many Linux distributions. It collects and stores logs from various parts of the system, including system services, kernel messages, and application logs.
How is the Systemd Journal Related to Kubelet Logs?
Kubelet logs its activities to the systemd journal. By storing these logs in the systemd journal, you can easily access and manage them using systemd tools.
Here Comes the journalctl?
Now we know where the logs are stored. How to access those? That's where the journalctl command comes in. journalctl is a command-line utility used to query and display logs from the systemd journal. It allows you to filter and search logs, making it easier to find specific information. This is particularly useful for accessing Kubelet logs and troubleshooting issues in your Kubernetes cluster.
Becoming Familiar with journalctl Command
Before we dive into the steps, let’s get familiar with the journalctl command. This command helps you view logs stored by systemd journal, including those from Kubelet.
Using journalctl, you can see all the logs the systemd journal has collected. For instance, running journalctl -bshows logs since the last system boot. This is helpful for understanding recent activity on your node.
To focus on Kubelet logs specifically, you can use the -u flag followed by kubelet. The command journalctl -u kubelet shows all logs related to the Kubelet service, making it easier to diagnose issues.
Now, let's get our hands dirty with kubelet log analyzing with a practical scenario.
Step 1: Setting Up Your Environment
Ensure you have a Kubernetes cluster running. You can use Minikube, Kind, or any cloud-based Kubernetes service like GKE, EKS, or AKS.
For this practical, we'll use the KodeKloud public playground version 1.30. I recommend using this environment because it saves time on setup and avoids the need to invest money in cloud providers.
Step 2: Generating Logs
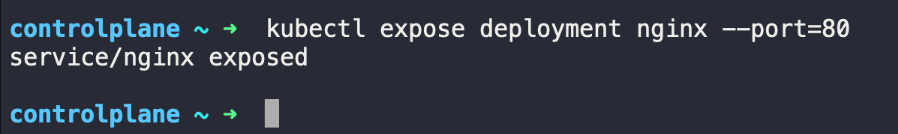
Deploy a sample application that is likely to generate some logs. For this example, we'll use a simple nginx deployment.

Step 3: Accessing Kubelet Logs
SSH into one of your Kubernetes nodes and run the following command to view the Kubelet logs.

This command filters the logs to show only those related to Kubelet.
Step 4: Filtering for Specific Issues
Simulate an error by deleting a necessary component.

Now, filter the logs to find relevant error messages.
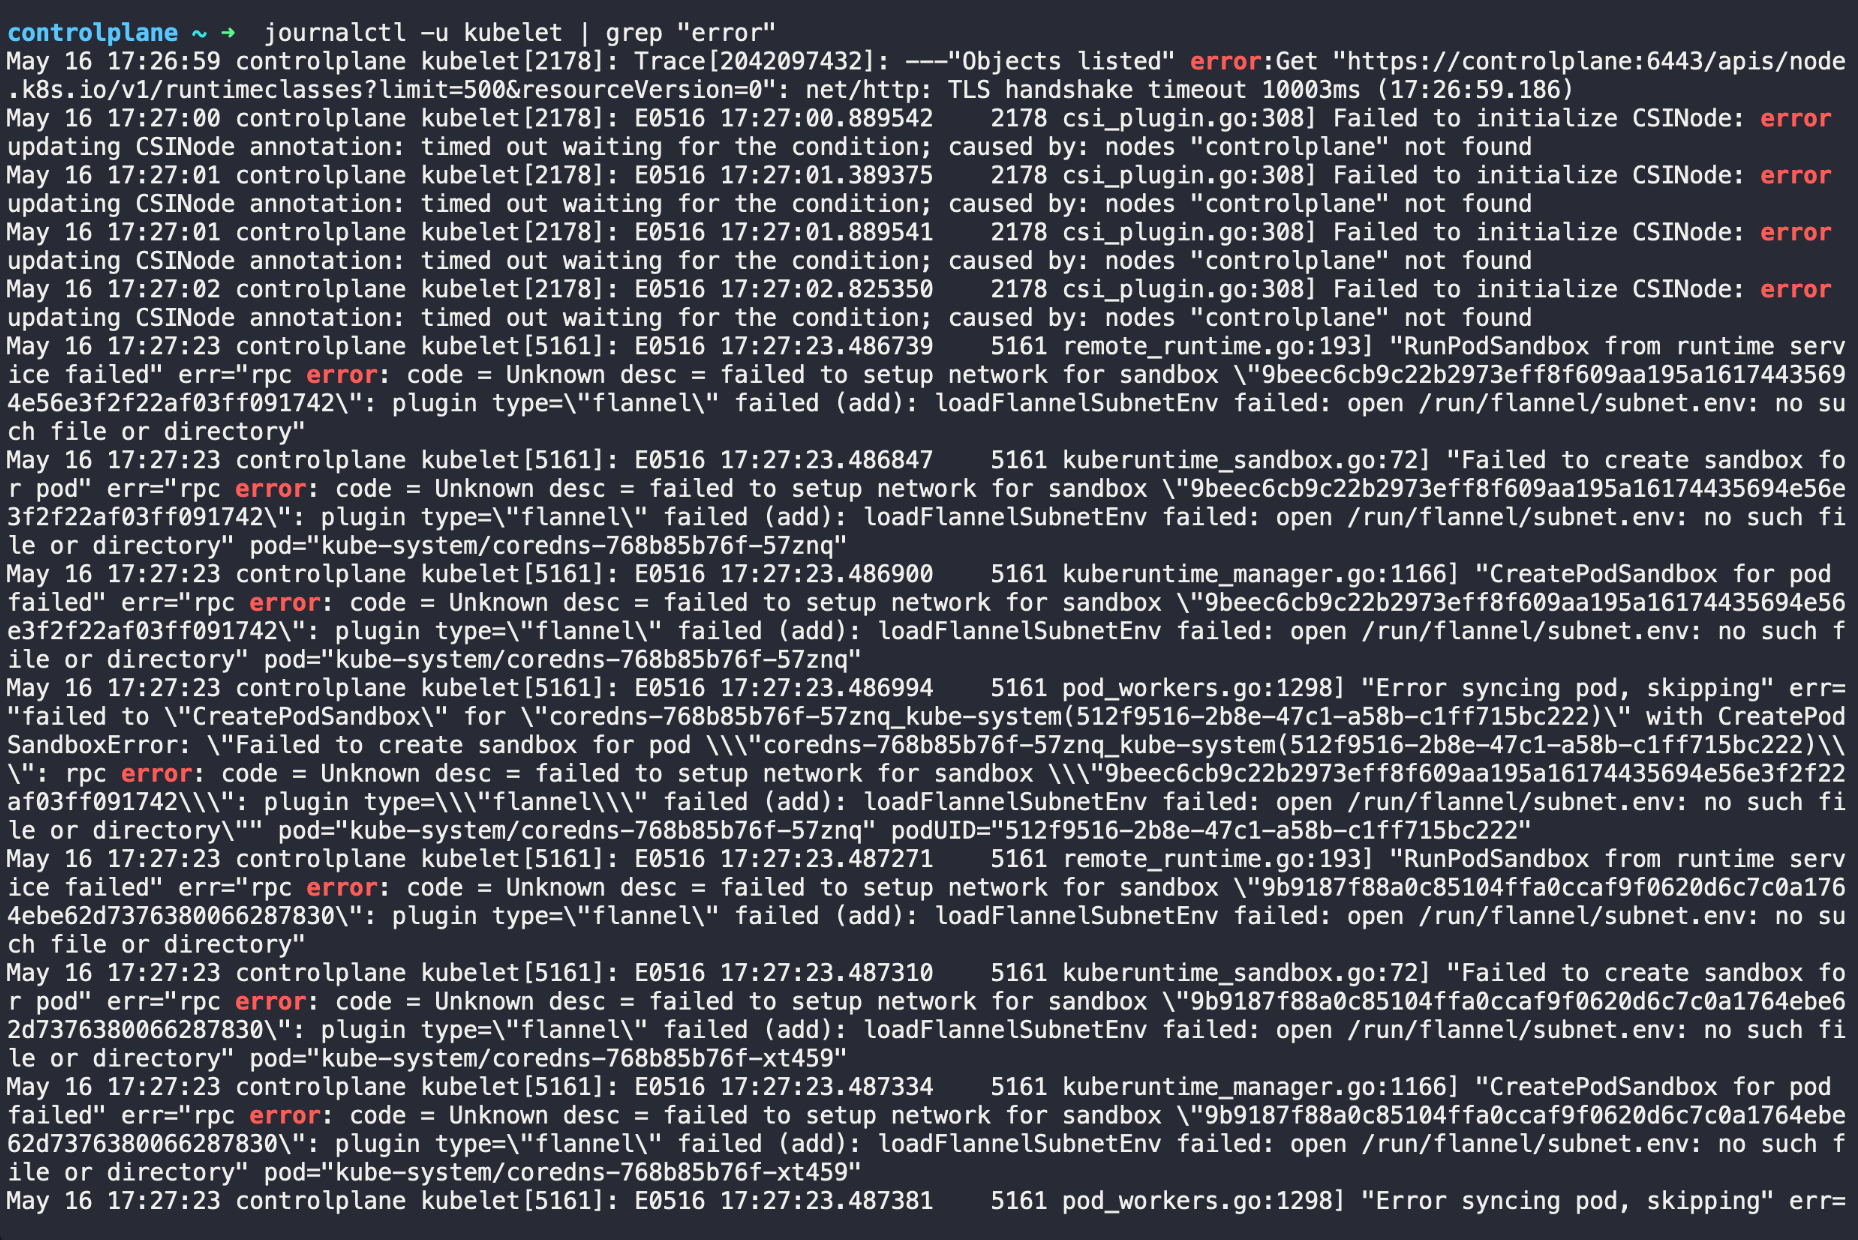
This will show any error messages logged by Kubelet, helping you identify the issue.
Step 5: Adjusting Verbosity Level
Increase the verbosity level to get more detailed logs.

Modify the KUBELET_CONFIG_ARGS to include --v=4. Save the file and restart Kubelet. Finally, Save the file and restart Kubelet. Higher verbosity levels provide more detailed logs, which can be helpful for troubleshooting complex issues.
The purpose of this short blog is to give you a starting point on analyzing Kubelet logs as a Kubernetes Administrator. Do check out our K8s Administrator learning path as well.

.webp)
By following these steps, you can effectively analyze Kubelet logs and gain valuable insights into the health and performance of your Kubernetes cluster. This hands-on practice in the KodeKloud public playground helps you get started, and I encourage you to experiment with our public playgrounds to enhance your skills and understanding of Kubernetes log analysis. Let's start getting our hands dirty with log analysis!


Discussion