Hi Team,
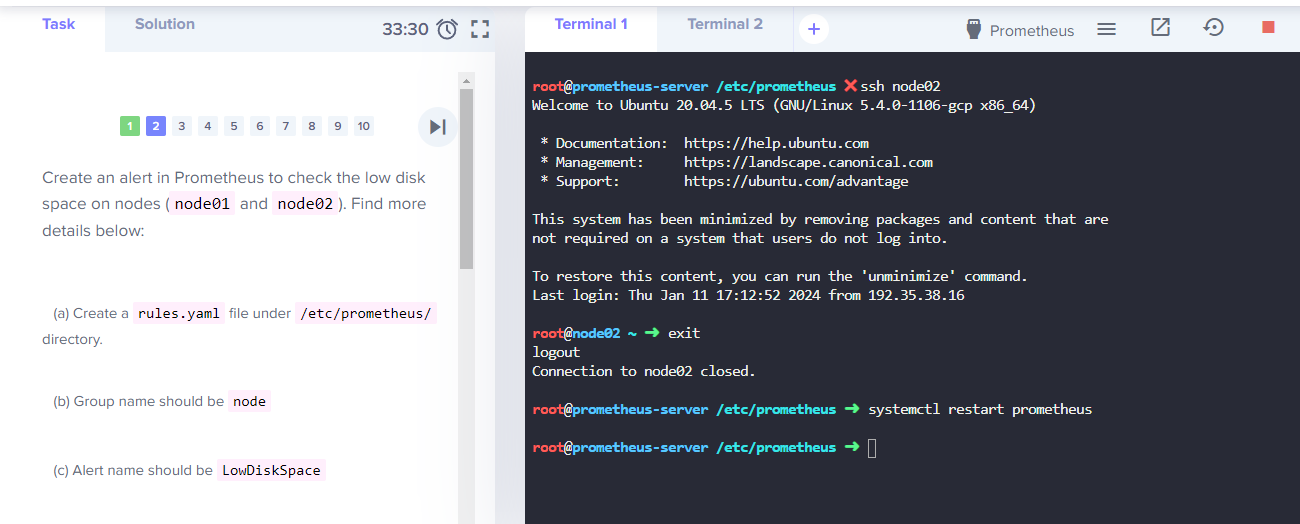
iam stuck in alert manager lab, i have created rules.yaml file in both node(01 &02) also edited file prometheus.yml in root@prometheus-server alternative also created prometheus.yml config file in both node still unable proceed. Also it ask for password while doing ssh from node01 to node02
lab link: Prometheus Certified Associate (PCA) | KodeKloud
Prometheus is installed on prometheus-server. This is where you will find its config file.
I edited Prometheus.yml config file in prometheus-server and also restart the prometheus still not able to proceed.
Define “unable to proceed”
Prometheus is not starting?
Alerts are not showing?
You can post prometheus.yaml and rules.yaml here
but please ensure to put them in code block like this
or all the formatting will be lost and I can’t check it
type or paste code here
/*# my global config
global:
scrape_interval: 15s # Set the scrape interval to every 15 seconds. Default is every 1 minute.
evaluation_interval: 15s # Evaluate rules every 15 seconds. The default is every 1 minute.
scrape_timeout is set to the global default (10s).
Alertmanager configuration
alerting:
alertmanagers:
- static_configs:
- targets:
#alertmanager:9093
Load rules once and periodically evaluate them according to the global ‘evaluation_interval’.
rule_files:
- “etc/prometheus/rules.yml”
- “etc/prometheus/rules.yml”
A scrape configuration containing exactly one endpoint to scrape:
Here it’s Prometheus itself.
scrape_configs:
The job name is added as a label job=<job_name> to any timeseries scraped from this config.
-
job_name: “prometheus”
metrics_path defaults to ‘/metrics’
scheme defaults to ‘http’.
static_configs:
- targets: [“localhost:9090”]
“prometheus.yml” 40L, 1231C
*/
I guess something is missing from my side pls help me to resolve the issue so can i procced with next questions in lab

[Screenshot 2024-01-07 150725|690x281](upload://ApPOIXhducp9Wfkyn77J9hxF6Ix.png)

[kodekloud|690x290](upload://eBmazz4LROEZDhUov7rzOpvfml3.png)
You have not put the actual YAML into the code blocks. It is not legible
And which question in it are you stuck on? Did you successfully complete questions before it? Looks like Q2
Did you look at the given solution in the Solution tab? It is correct - I just checked it
yes i check solution also even though iam not able to move to next question
yes Q1 was comleted stuck in Q2
/etc/prometheus/rules.yaml should contain exactly this
groups:
  - name: node
    rules:
      - alert: LowDiskSpace
        expr: 100 * node_filesystem_free_bytes{job="nodes"} / node_filesystem_size_bytes{job="nodes"} < 10
        labels:
          severity: warning
          environment: prod
/etc/prometheus/prometheus.yml should contain exactly this
# my global config
global:
  scrape_interval: 15s # Set the scrape interval to every 15 seconds. Default is every 1 minute.
  evaluation_interval: 15s # Evaluate rules every 15 seconds. The default is every 1 minute.
  # scrape_timeout is set to the global default (10s).

# Alertmanager configuration
alerting:
  alertmanagers:
    - static_configs:
        - targets:
          # - alertmanager:9093

# Load rules once and periodically evaluate them according to the global 'evaluation_interval'.
rule_files:
  - "/etc/prometheus/rules.yaml"
  # - "second_rules.yml"

# A scrape configuration containing exactly one endpoint to scrape:
# Here it's Prometheus itself.
scrape_configs:
  # The job name is added as a label `job=<job_name>` to any timeseries scraped from this config.
  - job_name: "prometheus"

    # metrics_path defaults to '/metrics'
    # scheme defaults to 'http'.

    static_configs:
      - targets: ["localhost:9090"]

  - job_name: "nodes"
    scheme: https
    tls_config:
      ca_file: /etc/prometheus/node_exporter.crt
      insecure_skip_verify: true
    basic_auth:
      username: prometheus
      password: secret-password
    static_configs:
      - targets: ["node01:9100", "node02:9100"]
Hi Alistair, thanks for fast response, it seems iam stuck in this question only
1)created rules.yaml file in /etc/prometheus/ directory in root@prometheus-server
2)Also done changes in prometheus.yaml as per solution still iam stuck in this unable to complete this question
3)should i install prometheus server on node01 and node02? what changes should i perform in node01 & node02?
You do not need to do anything on node01 or node02.
Only make the two files on prometheus-server exactly as I have pasted above.
The lab begins with Prometheus and both node exporters already installed.