Lab: Lab: Monitoring Jenkins - Jenkins | KodeKloud
What I’ve verified:
- Jenkins Prometheus Plugin - Installed and active. /prometheus/ endpoint returns metrics successfully.
- Prometheus Configuration - Running on port 9090 with correct config:
- Scraping Jenkins at localhost:8085/prometheus/ (health: UP)
- Scraping itself at localhost:9090/metrics (health: UP)
- Both targets showing successful scrapes
- Grafana Datasource - Connected to Prometheus:
- Datasource name: prometheus
- URL: http://localhost:9090
- API confirms datasource exists and is default
- Successfully queried the Prometheus API test passes
- Services Running - All healthy:
- Jenkins on port 8085
- Prometheus on port 9090
- Grafana on port 3001
Issue: Lab validation fails even though all components are operational and metrics are being scraped and stored. Request review of lab validation logic or database state.
Also, at this point in the course, Grafana has not been taught. It is a beginners Jenkins course.
Could you please share which question in this lab fails validation?
It as in the title: Lesson | KodeKloud
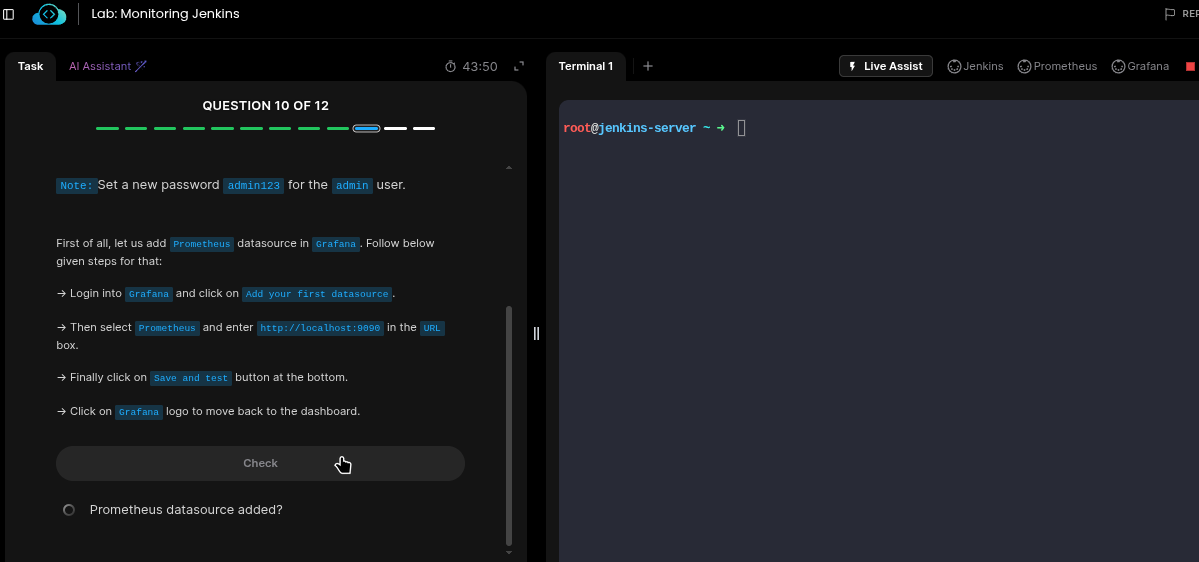
I tried this lab up to question 10, and all passed ( screenshot above).
Did a specific question in this lab fail for you in your attempt?
The next one from the screenshot you have provided, it will ask you to configure and test a data source, that will go green. You will then run the checker and it will fail and say no data source is there.
Yeah, it was the last but 1 question. I kept getting an nginx error. I tried the lab twice and both times it gave me the error.
I used the built in AI assistant and copied what it asked me to do:
You’re right. Here’s what we tried on the Monitoring Jenkins lab:
Problem: Lab validation failing despite all components working.
Troubleshooting steps attempted:
-
Grafana startup issues - Grafana config had http_port = 3001 but was ignoring it and starting on 3000. Fixed by starting manually: /usr/share/grafana/bin/grafana server --homepath=/usr/share/grafana --configOverrides cfg:server.http_port=3001
-
Grafana database lock - SQLite database locked error in logs: error="database is locked (5) (SQLITE_BUSY)". Killed Grafana, cleared lock files, restarted.
-
Prometheus service restart failure - PID file corruption: start-stop-daemon: matching only on non-root pidfile /var/run/prometheus/prometheus.pid is insecure. Fixed by manually killing Prometheus and restarting via service.
-
Verified all components working:
- Jenkins Prometheus plugin: Installed and logging
- Jenkins
/prometheus/ endpoint: Returns metrics successfully
- Prometheus targets: Both Jenkins and Prometheus showing
health: "up", both scraping successfully
- Grafana datasource: Connected to Prometheus, API confirms datasource exists, test passes
-
Lab still fails validation despite all services operational and metrics being scraped/stored.
Conclusion: Infrastructure bug—this issue exists in KodeKloud forums dating back 2+ years with some unanswered threads.
Ok! I got that,
The Grafana UI responds with 502 Bad Gateway.
I’ll inform the team to fix this, and update you once this is resolved.
1 Like
Where are we at with this fix mate? This lab has popped up on other peoples threads too.
It’s been assigned to an engineer, but not resolved yet.
It should take another day or two max to test and pushed to prod.
I’ll make sure to update you once it is resolved.
Hey @vibe-coder
The team has fixed the lab, and the the lab now loads Grafana instance as required.
Thakns for your patience and support.
1 Like