In the Question 3 of Lab-4(crashing pods) of the course Kubernetes Troubleshooting for Application Developers, in the hint section it is said that:
Check the events of the deployment
cart-api
but, the events shows nothing about this when i do k describe deployment cart-api
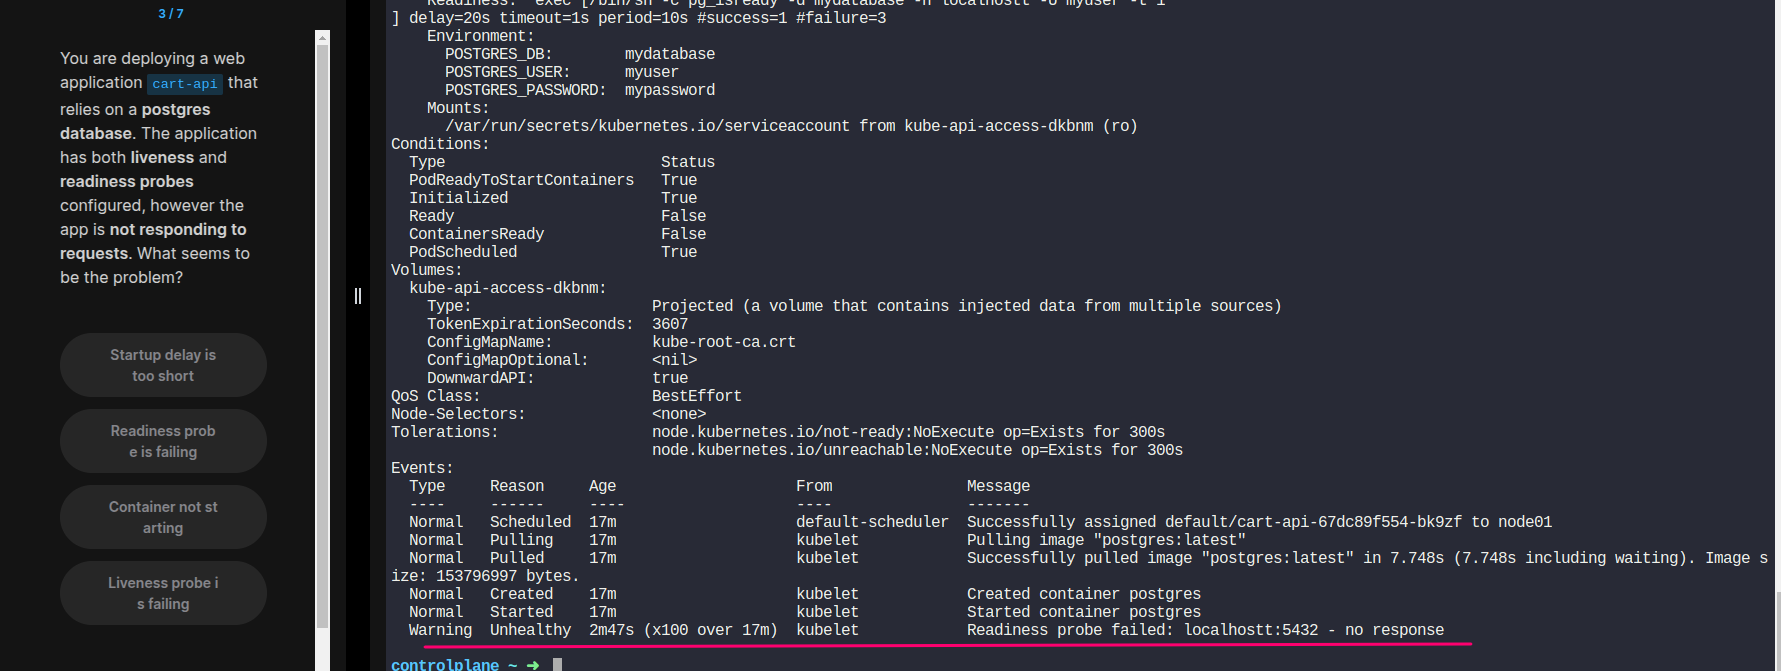
Events:
  Type    Reason             Age   From                   Message
  ----    ------             ----  ----                   -------
  Normal  ScalingReplicaSet  12m   deployment-controller  Scaled up replica set cart-api-67dc89f554 to 1
for k get deployments.apps cart-api -o yaml I get
# trimmed unrelated part
livenessProbe:
          exec:
            command:
            - /bin/sh
            - -c
            - |
              pg_isready -d mydatabase -h localhost -U myuser -t 1
          failureThreshold: 3
          initialDelaySeconds: 30
          periodSeconds: 10
          successThreshold: 1
          timeoutSeconds: 1
        name: postgres
        ports:
        - containerPort: 5432
          protocol: TCP
        readinessProbe:
          exec:
            command:
            - /bin/sh
            - -c
            - |
              pg_isready -d mydatabase -h localhostt -U myuser -t 1
          failureThreshold: 3
          initialDelaySeconds: 20
          periodSeconds: 10
          successThreshold: 1
          timeoutSeconds: 1

# trimmed unrelated part
status:
  conditions:
  - lastTransitionTime: "2025-02-08T05:24:28Z"
    lastUpdateTime: "2025-02-08T05:24:28Z"
    message: Deployment does not have minimum availability.
    reason: MinimumReplicasUnavailable
    status: "False"
    type: Available
  - lastTransitionTime: "2025-02-08T05:34:29Z"
    lastUpdateTime: "2025-02-08T05:34:29Z"
    message: ReplicaSet "cart-api-67dc89f554" has timed out progressing.
    reason: ProgressDeadlineExceeded
    status: "False"
    type: Progressing
  observedGeneration: 1
  replicas: 1
  unavailableReplicas: 1
  updatedReplicas: 1
for k logs cart-api-67dc89f554-4czfc
The files belonging to this database system will be owned by user "postgres".
This user must also own the server process.

The database cluster will be initialized with locale "en_US.utf8".
The default database encoding has accordingly been set to "UTF8".
The default text search configuration will be set to "english".

Data page checksums are disabled.

fixing permissions on existing directory /var/lib/postgresql/data ... ok
creating subdirectories ... ok
selecting dynamic shared memory implementation ... posix
selecting default "max_connections" ... 100
selecting default "shared_buffers" ... 128MB
selecting default time zone ... Etc/UTC
creating configuration files ... ok
running bootstrap script ... ok
performing post-bootstrap initialization ... ok
syncing data to disk ... ok


Success. You can now start the database server using:

initdb: warning: enabling "trust" authentication for local connections
initdb: hint: You can change this by editing pg_hba.conf or using the option -A, or --auth-local and --auth-host, the next time you run initdb.
    pg_ctl -D /var/lib/postgresql/data -l logfile start

waiting for server to start....2025-02-08 05:24:39.715 UTC [96] LOG:  starting PostgreSQL 17.2 (Debian 17.2-1.pgdg120+1) on x86_64-pc-linux-gnu, compiled by gcc (Debian 12.2.0-14) 12.2.0, 64-bit
2025-02-08 05:24:39.716 UTC [96] LOG:  listening on Unix socket "/var/run/postgresql/.s.PGSQL.5432"
2025-02-08 05:24:39.720 UTC [99] LOG:  database system was shut down at 2025-02-08 05:24:38 UTC
2025-02-08 05:24:39.724 UTC [96] LOG:  database system is ready to accept connections
 done
server started
CREATE DATABASE


/usr/local/bin/docker-entrypoint.sh: ignoring /docker-entrypoint-initdb.d/*

waiting for server to shut down...2025-02-08 05:24:39.906 UTC [96] LOG:  received fast shutdown request
.2025-02-08 05:24:39.908 UTC [96] LOG:  aborting any active transactions
2025-02-08 05:24:39.909 UTC [96] LOG:  background worker "logical replication launcher" (PID 102) exited with exit code 1
2025-02-08 05:24:39.910 UTC [97] LOG:  shutting down
2025-02-08 05:24:39.911 UTC [97] LOG:  checkpoint starting: shutdown immediate
2025-02-08 05:24:40.200 UTC [97] LOG:  checkpoint complete: wrote 921 buffers (5.6%); 0 WAL file(s) added, 0 removed, 0 recycled; write=0.010 s, sync=0.276 s, total=0.291 s; sync files=301, longest=0.004 s, average=0.001 s; distance=4238 kB, estimate=4238 kB; lsn=0/1908978, redo lsn=0/1908978
2025-02-08 05:24:40.206 UTC [96] LOG:  database system is shut down
 done
server stopped

PostgreSQL init process complete; ready for start up.

2025-02-08 05:24:40.228 UTC [1] LOG:  starting PostgreSQL 17.2 (Debian 17.2-1.pgdg120+1) on x86_64-pc-linux-gnu, compiled by gcc (Debian 12.2.0-14) 12.2.0, 64-bit
2025-02-08 05:24:40.229 UTC [1] LOG:  listening on IPv4 address "0.0.0.0", port 5432
2025-02-08 05:24:40.229 UTC [1] LOG:  listening on IPv6 address "::", port 5432
2025-02-08 05:24:40.232 UTC [1] LOG:  listening on Unix socket "/var/run/postgresql/.s.PGSQL.5432"
2025-02-08 05:24:40.236 UTC [112] LOG:  database system was shut down at 2025-02-08 05:24:40 UTC
2025-02-08 05:24:40.240 UTC [1] LOG:  database system is ready to accept connections
2025-02-08 05:29:40.274 UTC [110] LOG:  checkpoint starting: time
2025-02-08 05:29:44.716 UTC [110] LOG:  checkpoint complete: wrote 47 buffers (0.3%); 0 WAL file(s) added, 0 removed, 0 recycled; write=4.418 s, sync=0.005 s, total=4.443 s; sync files=12, longest=0.001 s, average=0.001 s; distance=269 kB, estimate=269 kB; lsn=0/194C0C8, redo lsn=0/194C038
the problem description (and the hint, and the solution) is about liveness and readiness probes but I can’t find anything related to this in describe or get or log. What I find is about replicasets.
Is there something wrong in the labs? or am I misunderstanding something?
I mean, how can I know if it’s readiness/liveness probe related problem, if there is nothing related to this in events section of describe?