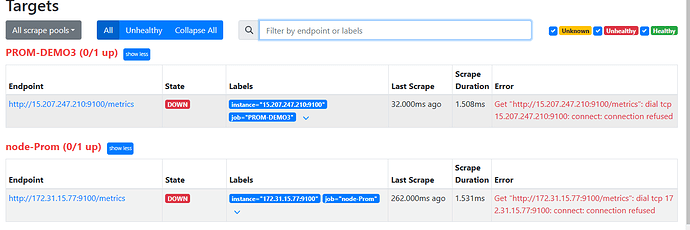
here, I present my prometheus.yml file and prometheus output (screenshort).
  alertmanagers:
    - static_configs:
        - targets:
          # - alertmanager:9093

# Load rules once and periodically evaluate them according to the global 'evaluation_interval'.
rule_files:
  # - "first_rules.yml"
  # - "second_rules.yml"

# A scrape configuration containing exactly one endpoint to scrape:
# Here it's Prometheus itself.
scrape_configs:
  # The job name is added as a label `job=<job_name>` to any timeseries scraped from this config.
  - job_name: "prometheus"

    # metrics_path defaults to '/metrics'
    # scheme defaults to 'http'.

    static_configs:
      - targets: ["localhost:9090"]

  - job_name: "node-Prom"
    static_configs:
      - targets: ["172.31.15.77:9100"] # Private IP of ec2, (On same vpc where Prometheus's ec2)

  - job_name: "PROM-DEMO3"
    static_configs:
      - targets: ["15.207.247.210:9100"] # Public IP of ec2, (On different vpc)
** Port 9100 is open on both ec2.
I can not understand this problem, Please help me to understand.
