Hello, I am having difficulties with the lab in the Kubernetes 2 section, title of the lab in the subject.
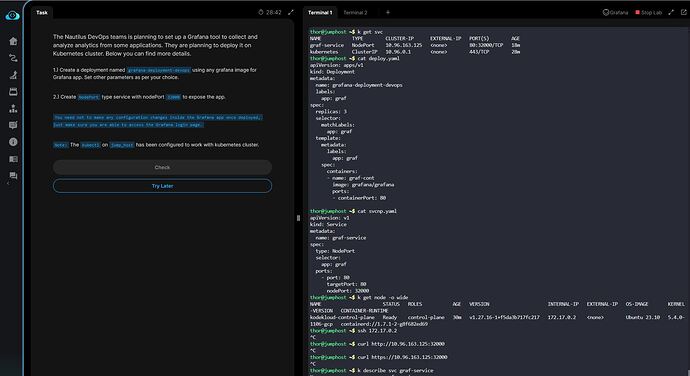
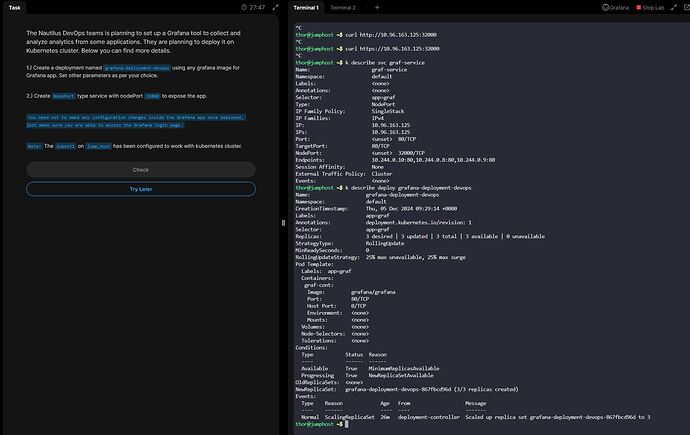
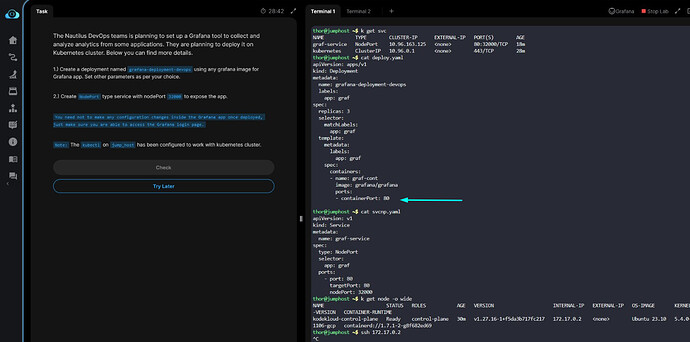
I created the deploy and the svc. They are connected via the label selector, the pods are up. But I cannot see the grafana webpage, only nginx.
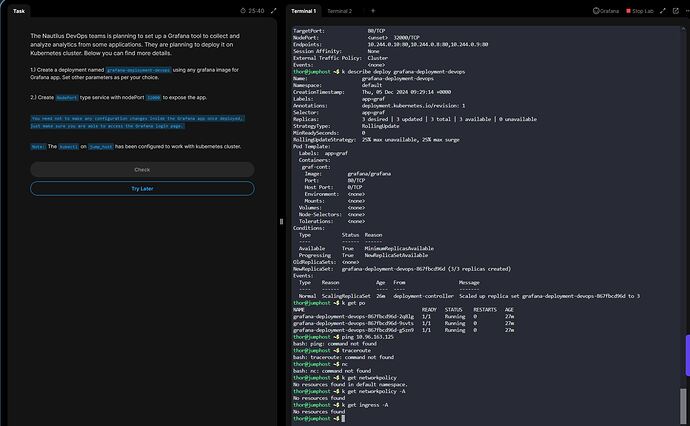
I add the screenshots of my configuration to show what I did.
I suppose there is an issue with the network somewhere, as the svc cannot be reached from the jumphost (curl) and I cannot ssh into the only node of the cluster (kodekloud-control-plane - 172.17.0.2) - so I cannot check if there is any firewall blocking the incoming connection, cannot see if the port is open, the routes, etc…
Could you please help me with this and point out to what I am doing wrong?
Thank you


