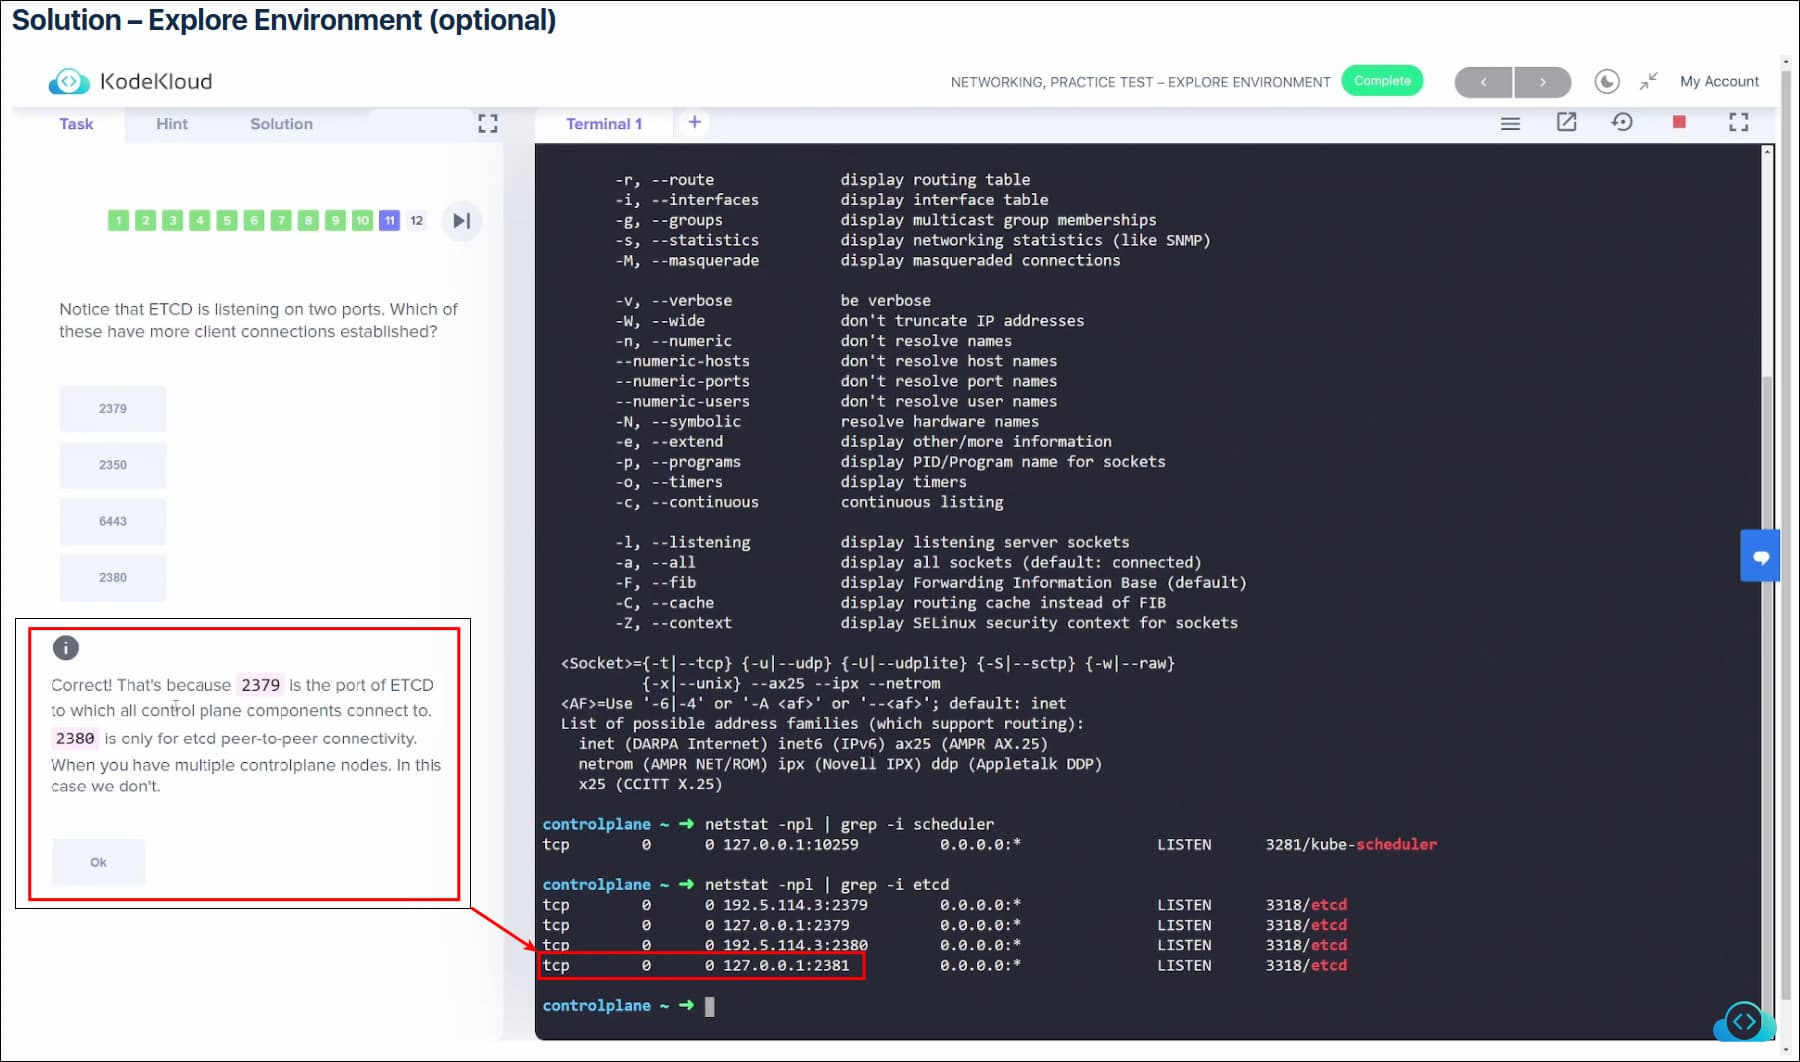
While taking the first practice test in the Networking section, I noticed that ETCD listens on ports 2379, 2380, and 2381. However, there’s no mention of it in the explanation. I think it’s important to mention what it’s for, since the other 2 ports are expanded on:
Port 2381/TCP (etcd): In kubeadm, this port is used for etcd metrics. It listens only on localhost, but does not require authentication or encryption on connection.
Whether this is a good idea or not depends upon how well locked down your cluster is.
I’m not sure if 2381 is an “official” etcd port, but clearly some distributions use it for metrics. Note that it’s at localhost and is not encrypted, as the note above said as well.
I saw a PR on Rancher to add that port to their documentation - August 2023. So it seems to be official though I have no documentation to support my hypothesis…
If you do what I did and tried to search the etcd website, you’ll find that 2381 gets no hits on the site. So I suspect that the default behavior of putting metrics on 2379 doesn’t work for some folks that bundle etcd, and it’s become “a thing”. As you can see from the minikube example, it’s easy enough to get etcd to listen on another port to handle metrics, be that 2381 or be it some other port.
It must be officially sanctioned somewhere… But where??? I concur that a google search for: 2381 site:etcd.io results in just 2 hits and 2381 is not mentioned in either -
Maybe KinD have recompiled their own version of etcd where port 2381 is enabled…
It doesn’t need to be officially enabled; you just have to use --listen-metrics-urls=http://127.0.0.1:2381. Thinking that the kubeadm people decided to do it. It may not be official, but it’s logical.
Aha. That’s the bit I was missing. So, it’s just another flag that can be enabled meaning that it isn’t mentioned at etcd.io as the port to use is left to the discretion of the cluster admin and hence could be anything as long as it’s >1023.