c410n
December 7, 2022, 5:36am
#1
I can’t login to Graphana in Jenkins | KodeKloud step 10.
The task says:
Let us see now, how we can use Grafana to visualise Jenkins metrics. Grafana is already installed and can be accessed using Grafana button on the top of the terminal.
Grafana credentials are:
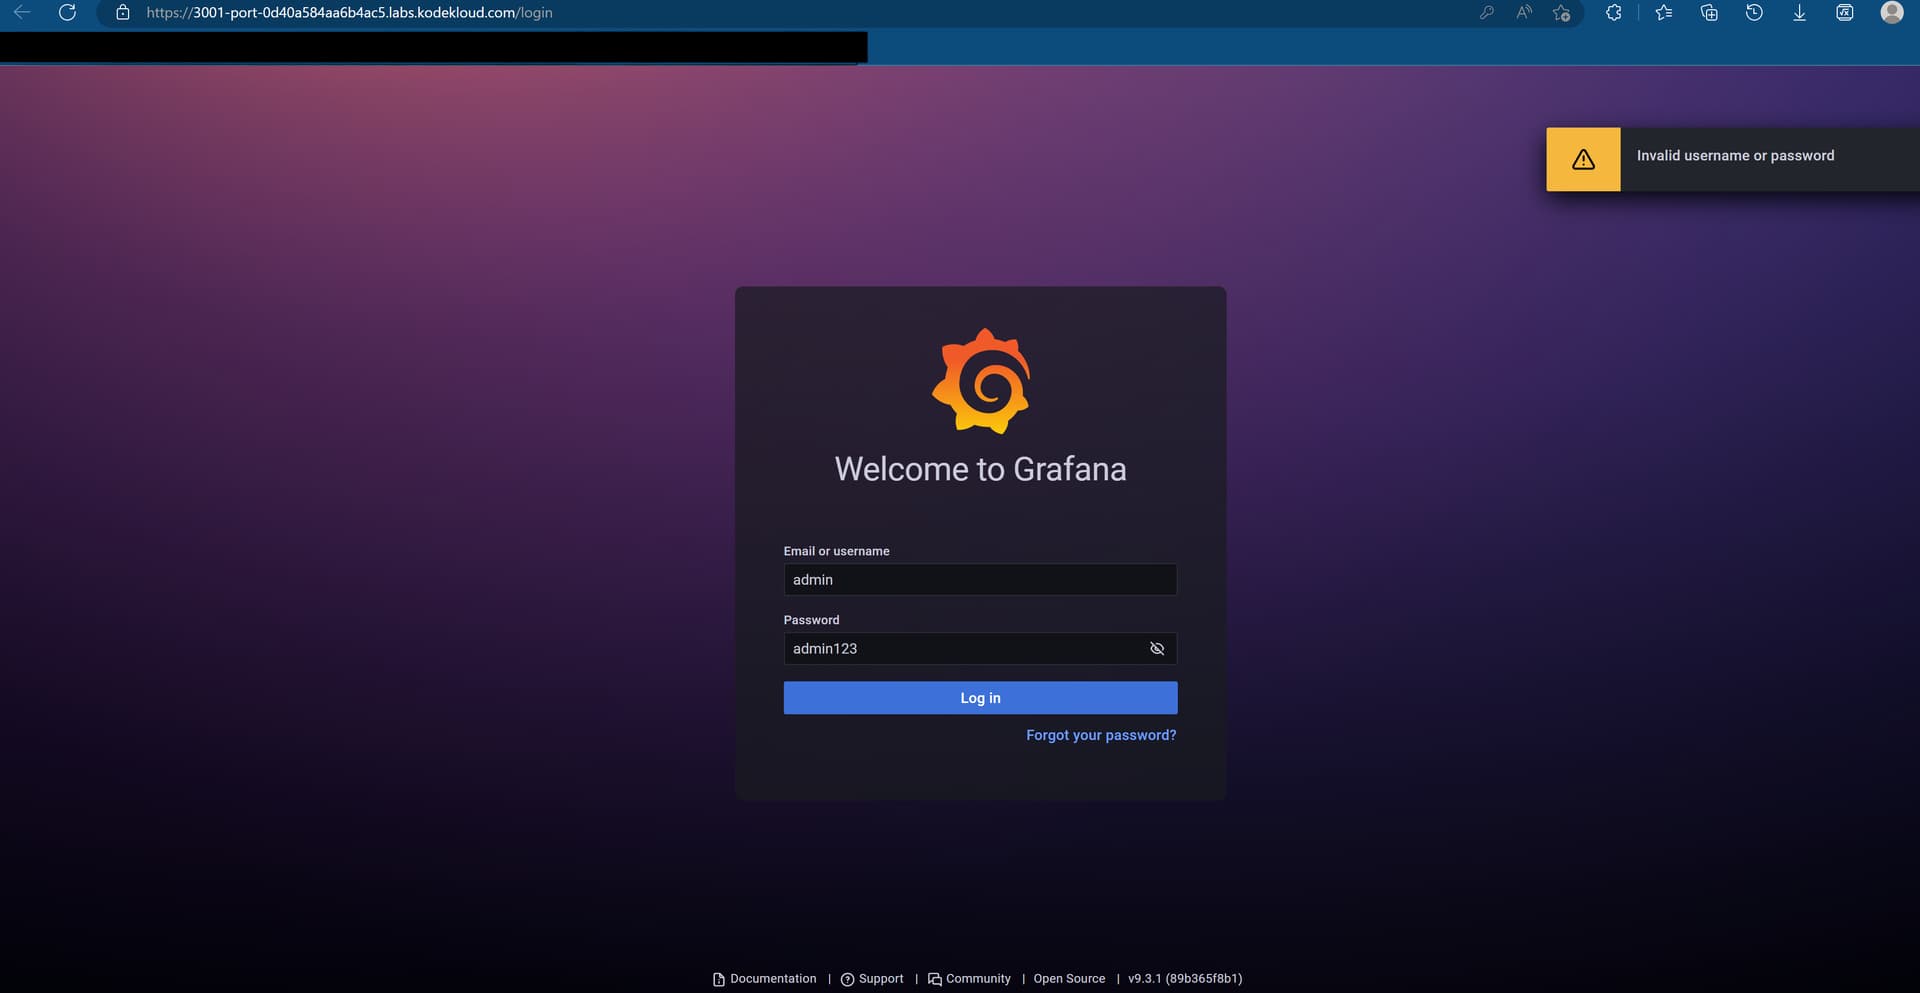
But these credentials don’t work for me. The page returns ‘Invalid username or password’
Hello @c410n ,
Thanks for reporting the issue with Jenkins lab, I forwarded this issue to the DevOps Lab team, they will check and fix it.
Thanks,
c410n
December 7, 2022, 4:25pm
#3
Thanks! Attaching a screenshot in case of
Thanks for your information @c410n , I already tried and confirm the issue, team fixing it.
@trung-kodekloud yeah same for me as well
Vhikram-Narasimhan:
yeah same for me as well
Hello @Vhikram-Narasimhan ,
We noticed this issue and the concerned team working on it, I will keep you posted.
Thanks,
Hi @c410n & @Vhikram-Narasimhan ,
Regards,