,hi i am not able to see metrics at this endpoint…kindly help
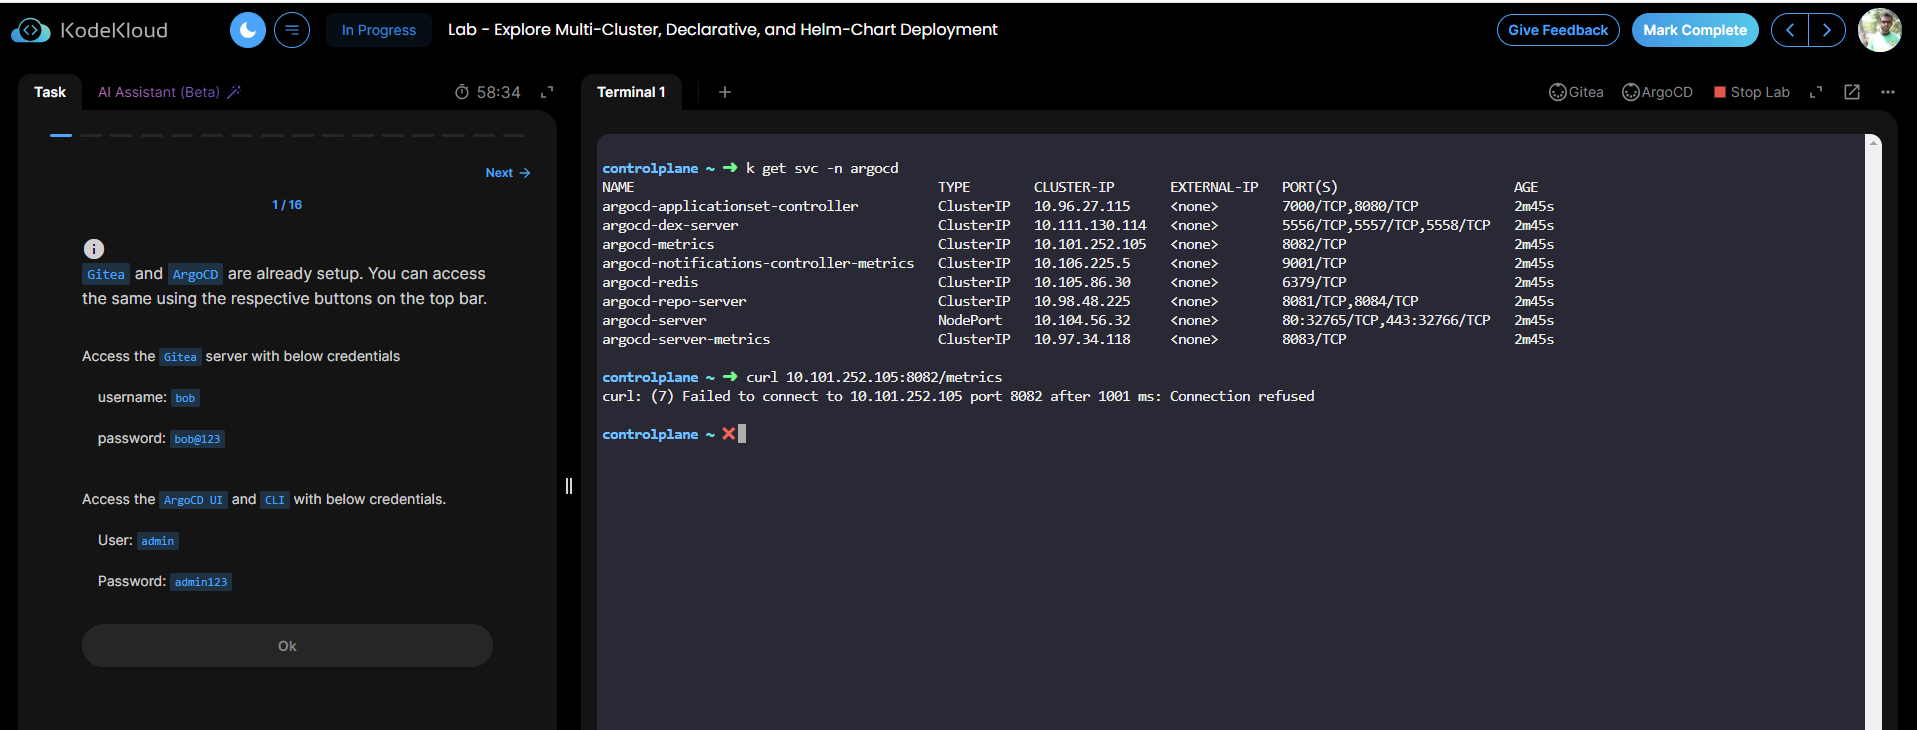
Not sure what’s going on by you. I’ve tried the same lab, and this is what I see:
controlplane ~ ➜  k -n argocd get svc
NAME                                      TYPE        CLUSTER-IP       EXTERNAL-IP   PORT(S)                      AGE
argocd-applicationset-controller          ClusterIP   10.110.81.179    <none>        7000/TCP,8080/TCP            11m
argocd-dex-server                         ClusterIP   10.101.191.226   <none>        5556/TCP,5557/TCP,5558/TCP   11m
argocd-metrics                            ClusterIP   10.99.143.189    <none>        8082/TCP                     11m
argocd-notifications-controller-metrics   ClusterIP   10.108.104.31    <none>        9001/TCP                     11m
argocd-redis                              ClusterIP   10.97.229.112    <none>        6379/TCP                     11m
argocd-repo-server                        ClusterIP   10.102.64.242    <none>        8081/TCP,8084/TCP            11m
argocd-server                             NodePort    10.107.58.124    <none>        80:32765/TCP,443:32766/TCP   11m
argocd-server-metrics                     ClusterIP   10.110.26.88     <none>        8083/TCP                     11m

controlplane ~ ➜  curl  10.110.26.88:8083/metrics | head
  % Total    % Received % Xferd  Average Speed   Time    Time     Time  Current
                                 Dload  Upload   Total   Spent    Left  Speed
  0     0    0     0    0     0      0      0 --:--:-- --:--:-- --:--:--     0# HELP go_gc_duration_seconds A summary of the pause duration of garbage collection cycles.
# TYPE go_gc_duration_seconds summary
go_gc_duration_seconds{quantile="0"} 8.4392e-05
go_gc_duration_seconds{quantile="0.25"} 0.000110102
go_gc_duration_seconds{quantile="0.5"} 0.00014428
go_gc_duration_seconds{quantile="0.75"} 0.000252045
go_gc_duration_seconds{quantile="1"} 0.000736074
go_gc_duration_seconds_sum 0.002247849
go_gc_duration_seconds_count 10
# HELP go_goroutines Number of goroutines that currently exist.
100 20290    0 20290    0     0  2973k      0 --:--:-- --:--:-- --:--:-- 3302k
curl: (23) Failure writing output to destination

``Pods were not getting scheduled…i added tolerations …now its working…