yash06
June 15, 2026, 9:10am
#1
Hello KodeKloud Team,
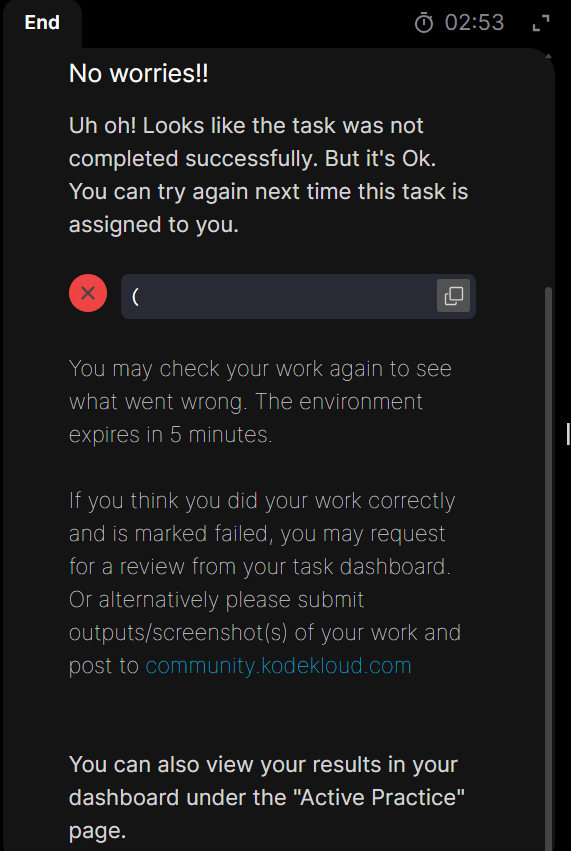
Below is the error image:
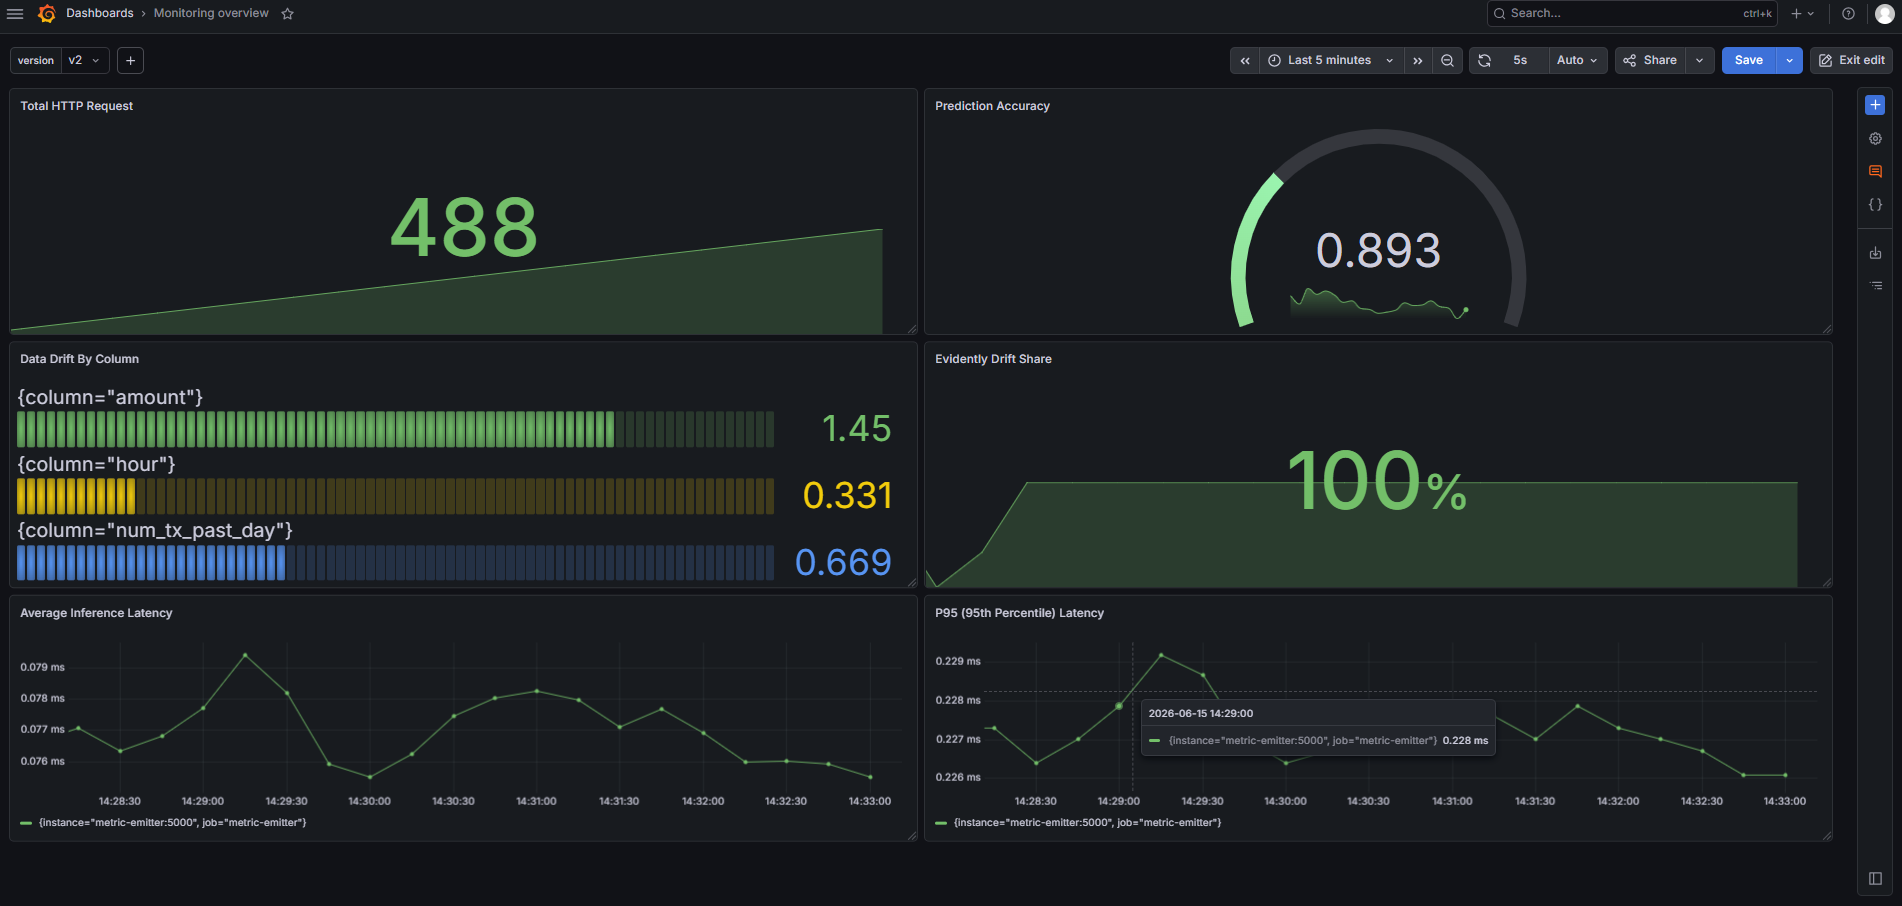
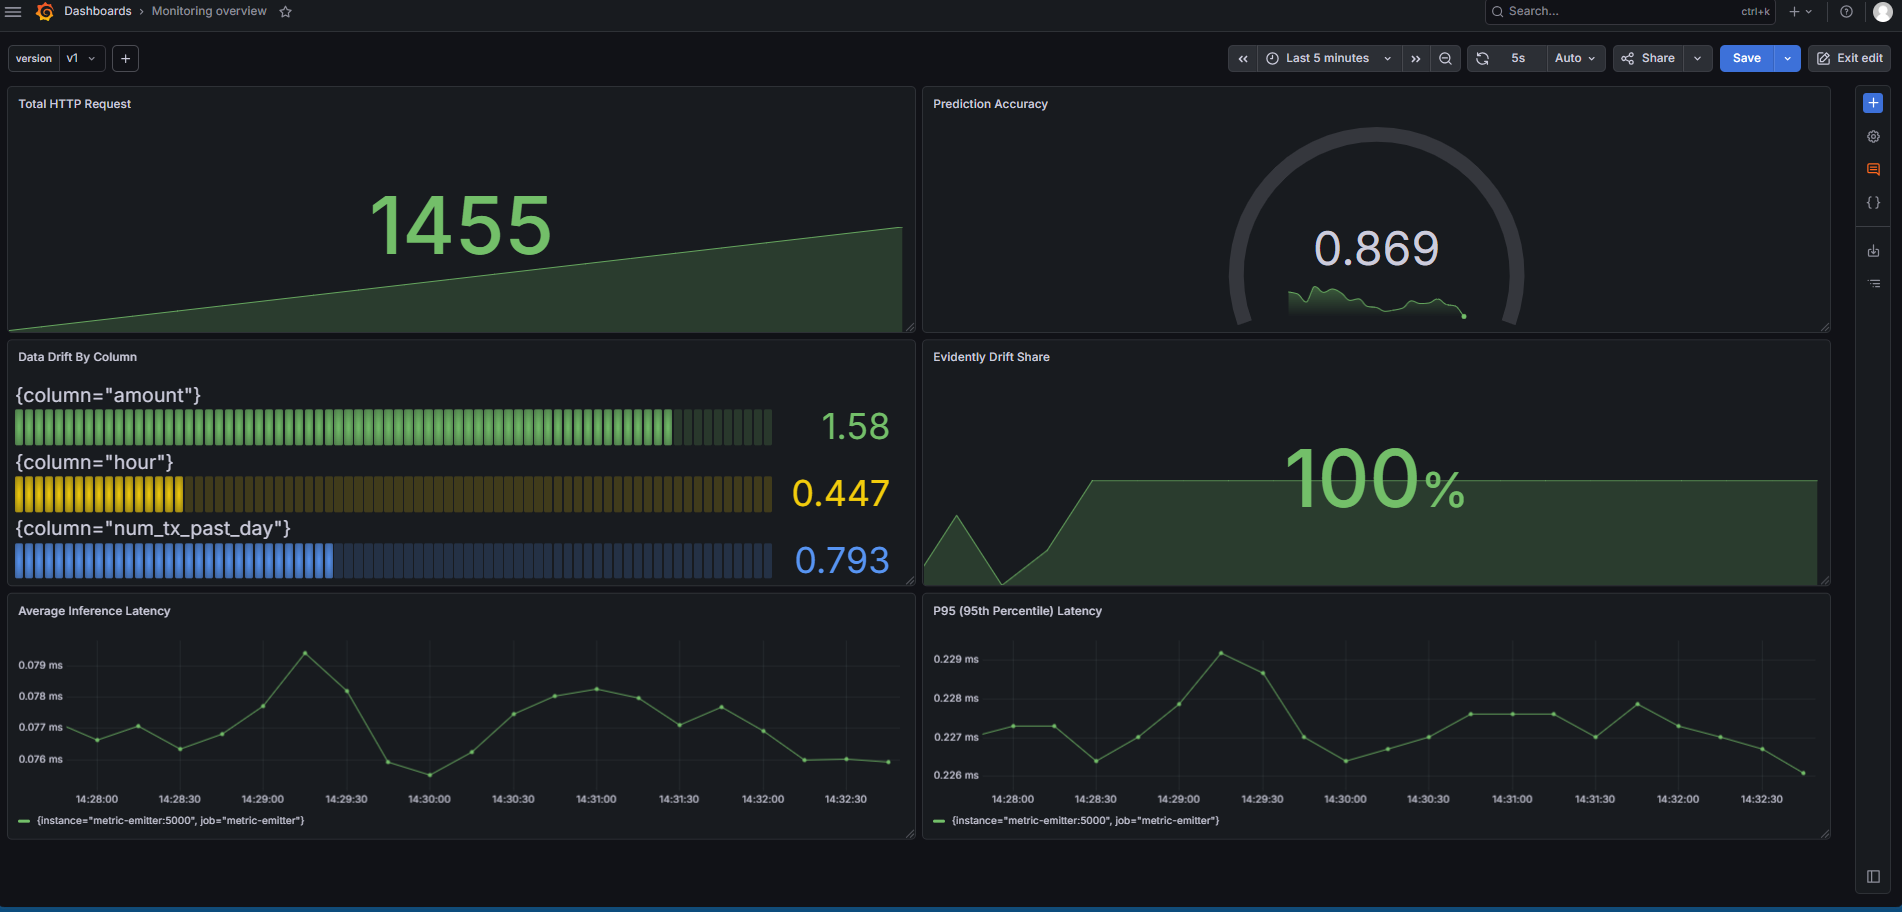
Below is the final dashboard which have created:
Can you please help me on this. So, i can move forward.
The task requires creating three panels in the dashboard. I don’t see a panel for p95 inference latency in your screenshot.
You can refer to the solution here .
yash06
June 15, 2026, 10:36am
#3
I do have that panel, but it is with different name.
Have you added the tag monitoring or mlops to the dashboard?
yash06
June 15, 2026, 11:22am
#5
Yes I did add the tag one was mlops and other was mlops-monitoring.
It was given either one.
yash06
June 15, 2026, 1:56pm
#6
I re attempted the question. I have cleared it.
Thank you for suggesstions