Highlights
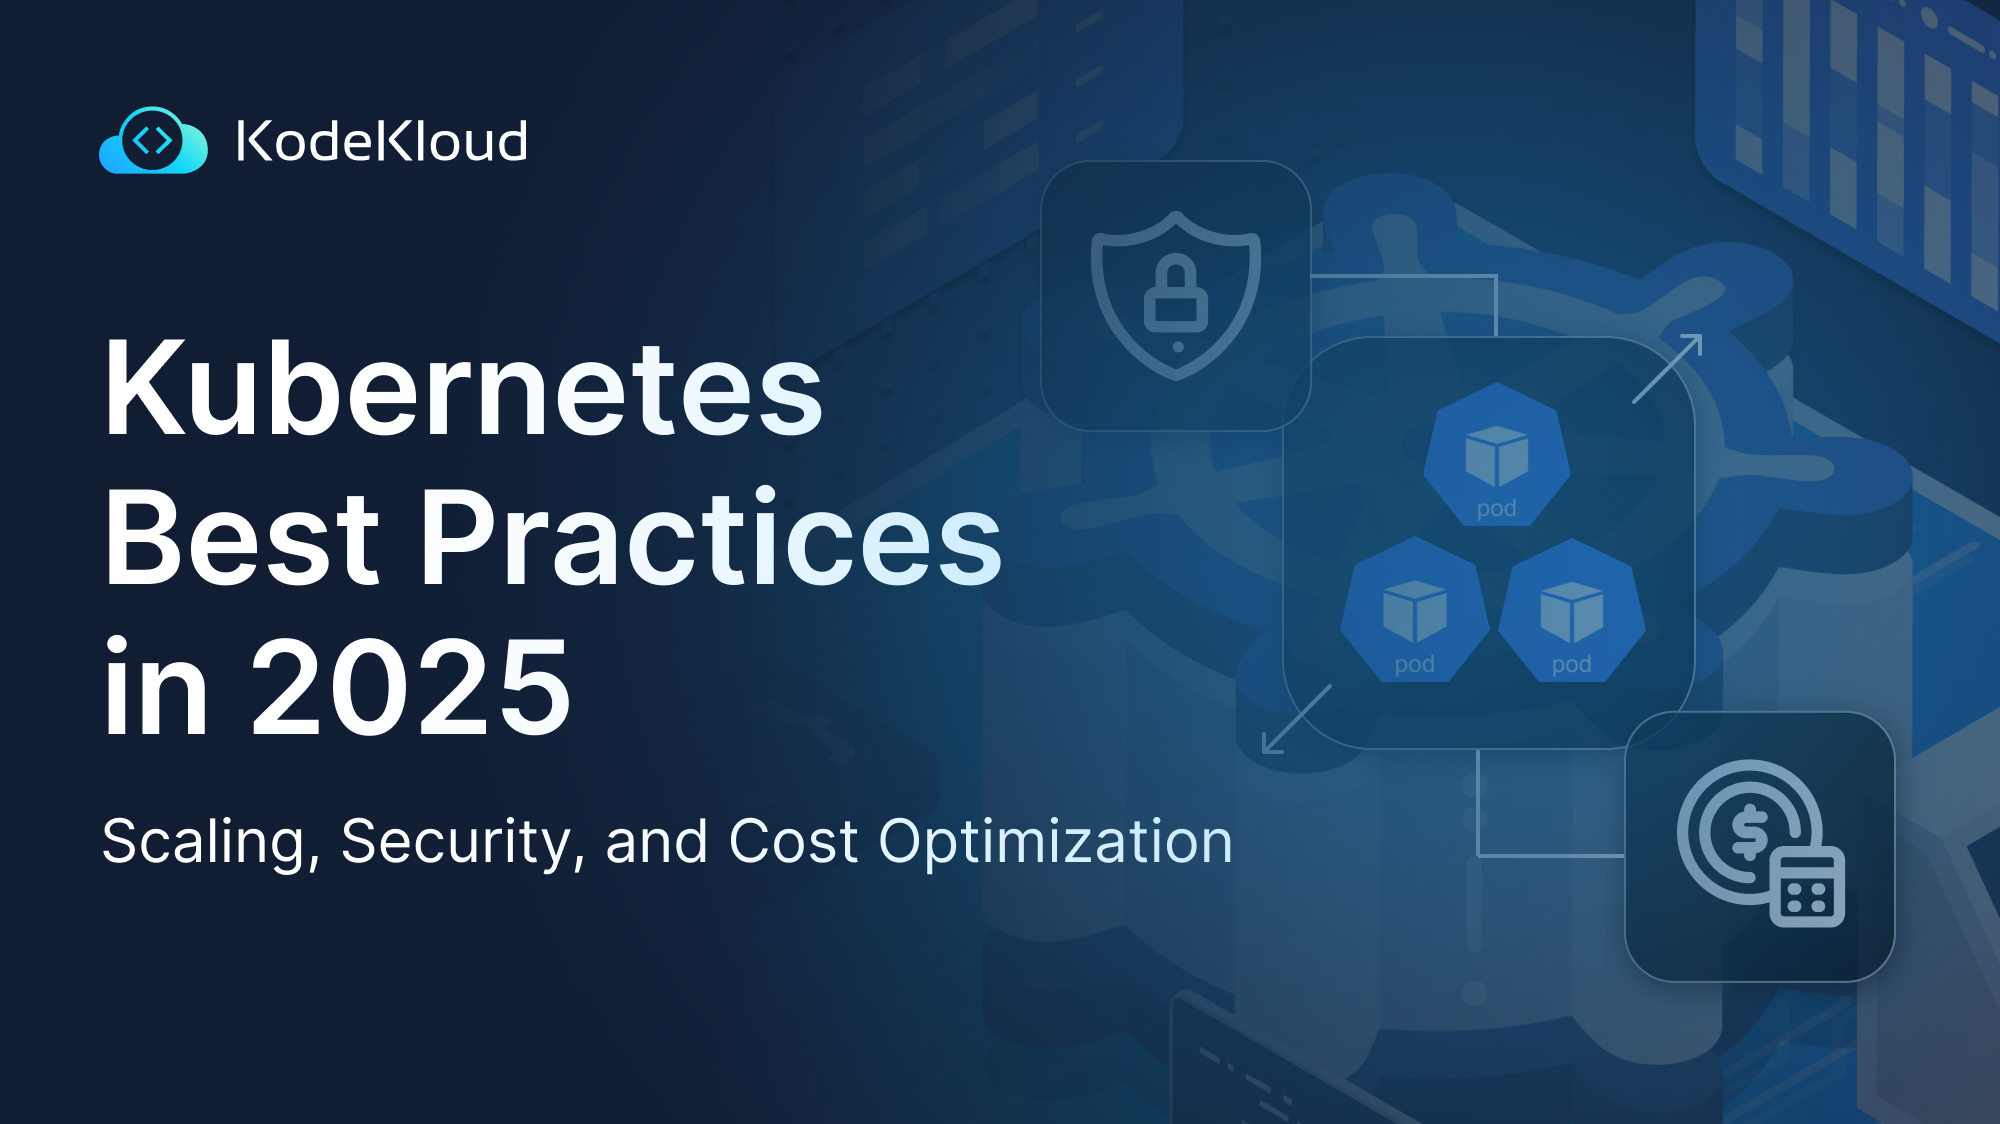
Why Kubernetes Best Practices Matter in 2025
- 87% of companies now run Kubernetes in hybrid-cloud setups.
- The challenge isn’t adoption - it’s optimization and security.
- Clusters are larger, faster, and business-critical than ever.
Scale Smarter, Not Just Bigger
- Combine HPA, VPA, and Cluster Autoscaler for data-driven scaling.
- Use resource quotas to keep teams fair and costs predictable.
- Practice live with KodeKloud scaling labs and dashboards.
Secure by Design
- Apply RBAC, Pod Security Standards, and Network Policies.
- Scan and sign container images with Trivy and Cosign.
- Learn security hands-on in the KodeKloud CKS course.
Optimize Cloud Costs
- Prevent overprovisioning with VPA and Kubecost insights.
- Mix spot + on-demand nodes for 60-90% savings.
- Monitor utilization with Prometheus + Grafana dashboards.
Observe Everything
- Implement full metrics, logs, and traces observability.
- Use OpenTelemetry + eBPF for deep visibility.
- Explore AIOps tools that predict and auto-heal issues.
Avoid 2025’s Top Kubernetes Mistakes
- Overprovisioning → Use VPA
- Ignoring security → Apply PSS and scanning
- Outdated versions → Regular upgrades
- Weak monitoring → Adopt observability stack
- Overprivileged RBAC → Enforce least privilege
Learn by Doing
KodeKloud offers hands-on Kubernetes labs for real-world scaling, cost optimization, and security scenarios - helping you move from theory to mastery.
Why Kubernetes Best Practices Matter in 2025
According to the Cloud Native Computing Foundation (CNCF),
87 % of organizations now deploy Kubernetes in hybrid-cloud environments, and 82 % plan to make them their primary application platform within the next five years.
(CNCF Blog, 2025)
That’s not just a statistic - it’s a wake-up call for DevOps engineers. As Kubernetes becomes the default platform for running modern workloads, the real challenge isn’t adoption anymore - it’s optimization. Teams that don’t follow the right Kubernetes best practices 2025 risk higher cloud bills, underperforming clusters, and serious security gaps.
In 2025, Kubernetes environments are larger, more dynamic, and deeply tied to business uptime. Scaling efficiently, securing workloads, and optimizing for cost aren’t optional - they define how successful your platform is.
📘 If you’re still learning the fundamentals, start with our Kubernetes Tutorial for Beginners 2025 before diving into best-practice strategies.
Key trends driving Kubernetes optimization in 2025
- Rapid multi-cluster and hybrid-cloud growth across industries
- Escalating cloud spend prompting smarter autoscaling and right-sizing
- Stronger focus on Kubernetes security 2025 through supply-chain hardening
- Deeper observability using Prometheus, Grafana, and OpenTelemetry
In short, the Kubernetes world has matured. The organizations that thrive in 2025 will be the ones applying structured Kubernetes best practices - balancing performance, security, and cost with precision.
Scaling Kubernetes Applications Efficiently
One of the biggest reasons teams adopt Kubernetes is its ability to scale applications automatically based on demand. But in 2025, scaling isn’t just about adding more Pods - it’s about scaling intelligently to balance performance, reliability, and cost.
Modern scaling strategies now use data-driven insights - combining autoscaling, resource tuning, and monitoring to keep workloads efficient and affordable.
Scaling without data is like flying blind - you might move fast, but you’ll crash into costs.
Horizontal Pod Autoscaler (HPA) and Vertical Pod Autoscaler (VPA)
The Horizontal Pod Autoscaler (HPA) automatically changes the number of Pods based on resource usage (like CPU). The Vertical Pod Autoscaler (VPA), on the other hand, adjusts CPU and memory requests for each Pod to maintain performance without overprovisioning.
Here’s a simple example of an HPA YAML configuration:
apiVersion: autoscaling/v2
kind: HorizontalPodAutoscaler
metadata:
  name: frontend-hpa
spec:
  scaleTargetRef:
    apiVersion: apps/v1
    kind: Deployment
    name: frontend
  minReplicas: 2
  maxReplicas: 10
  metrics:
  - type: Resource
    resource:
      name: cpu
      target:
        type: Utilization
        averageUtilization: 70
What this does:
- Keeps at least 2 Pods running at all times
- Scales up to 10 Pods if CPU utilization exceeds 70%
- Uses real-time metrics from the Kubernetes Metrics Server
In production, link this to custom metrics via Prometheus Adapter for more accurate scaling (e.g., request latency or queue size).
Cluster Autoscaler and Resource Quotas
The Cluster Autoscaler dynamically adjusts the number of nodes in your cluster. When workloads exceed capacity, it adds nodes; when usage drops, it removes idle ones.
Pairing this with resource quotas ensures that each namespace has fair limits - preventing one team from exhausting cluster resources.
Example command to set a resource quota:
kubectl create quota team-a-quota \
  --hard=pods=50,requests.cpu=20,requests.memory=40Gi
Combine autoscaling and quotas to control costs and performance simultaneously.
Right-Sizing Containers for Performance
Right-sizing means assigning just enough CPU and memory - not too much, not too little. You can specify this inside your Deployment manifest:
resources:
  requests:
    cpu: "200m"
    memory: "256Mi"
  limits:
    cpu: "500m"
    memory: "512Mi"
This tells Kubernetes:
- The container needs at least 200 milliCPU and 256 MiB memory to start.
- It can’t exceed 500 milliCPU and 512 MiB even under load.
Requests define guarantees; limits define ceilings.
Using KodeKloud’s Kubernetes Labs to Practice Scaling
Theory is great - but seeing scaling in action builds confidence. With KodeKloud’s Kubernetes Hands-On Labs, you can simulate real scaling environments:
- Practice HPA and VPA behavior in live clusters
- Experiment with Cluster Autoscaler and resource quotas
- Observe scaling metrics through Prometheus + Grafana dashboards
Recommended KodeKloud courses for scaling practice:
- Kubernetes for the Absolute Beginners - foundational scaling with Deployments and ReplicaSets
- CKA Certification Course - real-world scaling and cluster tuning scenarios
KodeKloud gives you a risk-free sandbox to learn Kubernetes scaling best practices hands-on.
Securing Your Kubernetes Cluster in 2025
With Kubernetes powering production workloads across every major industry, security is now at the center of every architecture discussion. In 2025, the threats have evolved - misconfigurations, unverified container images, and exposed dashboards remain common attack vectors.
That’s why following Kubernetes security 2025 best practices is essential for keeping your clusters compliant, reliable, and attack-resistant.
🔐 Security isn’t a one-time setup - it’s an ongoing process of least privilege, continuous monitoring, and proactive auditing.
Role-Based Access Control (RBAC) and Secrets Management
Start by tightening who can access what inside your cluster. Use RBAC to define fine-grained permissions and Secrets for storing sensitive data like passwords or API keys.
A simple RBAC Role + RoleBinding example:
apiVersion: rbac.authorization.k8s.io/v1
kind: Role
metadata:
  name: read-pods
  namespace: dev
rules:
- apiGroups: [""]
  resources: ["pods"]
  verbs: ["get", "list", "watch"]
---
apiVersion: rbac.authorization.k8s.io/v1
kind: RoleBinding
metadata:
  name: read-pods-binding
  namespace: dev
subjects:
- kind: User
  name: dev-user
  apiGroup: rbac.authorization.k8s.io
roleRef:
  kind: Role
  name: read-pods
  apiGroup: rbac.authorization.k8s.io
And to store credentials safely:
kubectl create secret generic db-secret \
  --from-literal=username=admin \
  --from-literal=password='p@ssw0rd!'
Avoid mounting Secrets as environment variables whenever possible - use mounted volumes or external secret managers like AWS Secrets Manager or Vault.
Implementing Network Policies and Pod Security Standards
Even if your workloads are isolated by namespace, Pods can still talk to each other by default. That’s why enforcing Network Policies is key to limiting traffic within the cluster.
Basic Network Policy YAML:
apiVersion: networking.k8s.io/v1
kind: NetworkPolicy
metadata:
  name: allow-frontend-to-backend
  namespace: app
spec:
  podSelector:
    matchLabels:
      role: backend
  policyTypes:
  - Ingress
  ingress:
  - from:
    - podSelector:
        matchLabels:
          role: frontend
This ensures only Pods labeled frontend can reach the backend service.
Next, apply Pod Security Standards (PSS) through Pod Security Admission to block unsafe workloads:
apiVersion: v1
kind: Namespace
metadata:
  name: secure-zone
  labels:
    pod-security.kubernetes.io/enforce: restricted
Namespaces with “restricted” policy enforce least privilege - no root containers, no host mounts, and controlled capabilities.
Supply-Chain Security and Image Scanning
In 2025, supply-chain attacks are one of the biggest risks for Kubernetes environments. Always use trusted image registries, and integrate scanning tools like Trivy, Clair, or Grype into your CI/CD pipeline.
Example:
trivy image myregistry/app:1.0Also, sign your images using cosign from Sigstore:
cosign sign myregistry/app:1.0
cosign verify myregistry/app:1.0
Never deploy unsigned or unscanned images - image provenance is now a compliance requirement for many enterprises.
Learn Kubernetes Security Hands-On with KodeKloud Labs
The best way to internalize these concepts is through guided practice.
The Kubernetes Security Specialist (CKS) course on KodeKloud provides:
- Real-cluster hardening labs
- Hands-on RBAC and Network Policy configurations
- Image scanning and runtime protection exercises
KodeKloud’s CKS course is built around real CNCF exam objectives - perfect for mastering cluster security in 2025.
Kubernetes Cost Optimization Strategies
In 2025, Kubernetes continues to dominate enterprise infrastructure - but with great flexibility comes great waste. According to the Cast AI 2025 Kubernetes Cost Benchmark Report, 99.94 % of clusters are over-provisioned, with average CPU utilisation at just 10 % and memory utilisation around 23 %.
That means nearly three-quarters of allocated cloud spend is sitting idle.
Optimising Kubernetes costs isn’t about cutting corners - it’s about ensuring every CPU cycle and byte of memory is doing useful work.
Right-Sizing Clusters and Workloads
The report shows that CPU over-provisioning averages 40 %, while memory over-provisioning hits 57 % - mostly due to manual sizing and lack of feedback loops.
To prevent this, always set realistic requests and limits in your Deployment YAMLs:
resources:
  requests:
    cpu: "250m"
    memory: "256Mi"
  limits:
    cpu: "500m"
    memory: "512Mi"
This simple practice helps maintain scheduling efficiency while keeping costs predictable. Tools like Kubecost, Kubevious, or Goldilocks can recommend optimal values based on historic usage.
Leverage Spot Instances and Node Pool Optimization
Cloud-provider data shows huge cost differences for spot compute:
- Azure offers up to 90 % discounts on GPU-powered spot instances
- AWS averages 67 %, and GCP around 66 %
(Cast AI Report 2025)
Spot nodes can be a game-changer for non-critical workloads. Here’s how you can enable autoscaling with mixed node pools:
gcloud container clusters update my-cluster \
  --enable-autoscaling --min-nodes=1 --max-nodes=10 \
  --zone=us-west1-a
Best practice: Assign spot nodes to workloads withtolerationsandtaints, and keep mission-critical services on on-demand nodes for stability.
Use Namespaces and Resource Quotas for Cost Control
To avoid one team consuming all your cluster resources, set quotas per namespace.
apiVersion: v1
kind: ResourceQuota
metadata:
  name: team-quota
  namespace: backend
spec:
  hard:
    requests.cpu: "20"
    limits.cpu: "40"
    requests.memory: "40Gi"
    limits.memory: "80Gi"
This enforces clear boundaries and prevents runaway spending.
Monitor, Measure, and Reduce Idle Time
Another insight from Cast AI: GPU workloads often suffer from high idle time and unused memory, leading to major financial waste. The report recommends tracking:
- Idle time (identify paused or under-used Pods)
- Wasted memory
- Dollar waste per workload
- Average GPU utilisation
Using Prometheus, Grafana, and Metrics Server, you can visualise this data and take action automatically - scaling down or pausing idle deployments.
Practice Kubernetes Cost Optimization with KodeKloud Labs
Theory alone doesn’t make your clusters cheaper - practice does. With KodeKloud’s Kubernetes Hands-On Labs, you can:
- Simulate mixed node pools and autoscaling
- Experiment with quotas and cost dashboards
- Understand utilisation trends in real-time clusters
Resources to explore:
- FinOps Certified Practitioner - Take control of your cloud spending! Master cloud cost optimization, build strong teams, and embrace industry best practices.
- Cloud Cost Management Guide(Ebook) - Your First-Hand Guide to Cloud Cost Management with FinOps
- Taking Control of Cloud Costs(Blog) - Master cloud cost optimization, build strong teams, and embrace industry best practices
KodeKloud helps you move from theoretical savings to measurable results.
Kubernetes Observability and Performance Tuning
By 2025, observability has moved from a “nice-to-have” to an absolute survival skill for engineering teams running Kubernetes at scale. According to Logz.io’s How to Effectively Monitor Kubernetes in 2025 by Jade Lassery, today’s clusters are more dynamic, ephemeral, and distributed than ever. Teams face hundreds of pods that start and stop in seconds, multi-cluster environments, and complex service meshes - meaning monitoring alone isn’t enough.
The CTO2B.io Kubernetes Observability Report reinforces the same reality: modern DevOps teams are shifting from traditional dashboards to end-to-end observability. This means capturing metrics, logs, and traces together, enriched by contextual AI insights that help detect anomalies, pinpoint root causes, and even automate remediation.
In short: 2025 Kubernetes success stories all share one thing - they don’t just watch their clusters; they understand them.
Why Observability Is the Foundation of Performance
Observability lets you answer why something went wrong, not just what broke.
Key industry takeaways:
- Ephemeral systems: Pods and containers vanish fast - without persistent logging and metrics, their states disappear too.
- Deep abstraction layers: Performance issues might stem from a node, a runtime, or cross-service latency.
- FinOps meets DevOps: Observability data is now essential for cost optimization, revealing underutilized CPU/memory and enabling right-sizing decisions.
- Security visibility: Continuous monitoring of API server logs, RBAC changes, and network policies prevents silent security drifts.
These align perfectly with the Logz.io report’s call for “unified monitoring to manage the chaos of ephemeral pods, service meshes, and multilayered abstractions.”
Core Pillars: Metrics, Logs, and Traces
The official Kubernetes documentation defines observability through three pillars:
- Metrics - numeric time-series data (CPU, memory, latency, etc.)
- Logs - contextual text output from applications and system components
- Traces - distributed request paths across microservices
Example: Prometheus ServiceMonitor YAML
apiVersion: monitoring.coreos.com/v1
kind: ServiceMonitor
metadata:
  name: webapp-monitor
  namespace: monitoring
spec:
  selector:
    matchLabels:
      app: webapp
  endpoints:
    - port: metrics
      interval: 15s
This tells Prometheus to automatically discover and scrape webapp metrics every 15 seconds - ideal for HPA tuning or alerting thresholds.
Bringing AI into Observability (AIOps)
AIOps-driven observability tools (like Logz.io and Datadog) now combine telemetry and intelligence:
- Contextual Alert Correlation: Dozens of raw alerts can be grouped into one meaningful incident (“Node-3 memory pressure → cascading pod restarts”).
- Automated Root-Cause Analysis: Correlate metrics, logs, and traces across layers to pinpoint failure origins.
- Predictive Analytics: ML models forecast cluster bottlenecks and capacity shortfalls before they cause outages.
- Guided or Automated Remediation: Tools trigger runbooks or webhooks for known patterns - restarts, rollbacks, or scaling fixes - with minimal human input.
This automation trend reduces MTTR from hours to minutes, aligning with modern SRE principles.
eBPF and OpenTelemetry: Deep Observability for 2025
- eBPF-powered tools like Cilium + Hubble provide kernel-level insight into network traffic and service-to-service communication.
- OpenTelemetry (OTel) has become the de facto CNCF standard for instrumenting telemetry data across metrics, logs, and traces - all vendor-neutral and pluggable.
Example: Installing OpenTelemetry Collector (DaemonSet mode)
helm repo add open-telemetry https://open-telemetry.github.io/opentelemetry-helm-charts
helm repo update
helm install otel-agent open-telemetry/opentelemetry-collector \
  --namespace observability --create-namespace \
  --set mode=daemonset
Then deploy a second instance in Deployment mode to collect and forward cluster-level telemetry - one of the recommended setups from CNCF.
How KodeKloud Helps You Master Observability
Hands-on learning is the fastest way to internalize observability principles. Through KodeKloud Prometheus Grafana Playground, you can:
- Build Prometheus + Grafana dashboards and configure alert rules.
- Deploy and test OpenTelemetry Collectors in real clusters.
- Simulate latency and memory pressure, then trace root causes.
- Practice observability integration in courses like:
- Prometheus Certified Associate(PCA)
- Grafana Loki
- Open Telemetry Certified Associate(OTCA) - Coming Soon
Pro tip: Treat observability as both a defensive and offensive practice - it helps prevent downtime and also reveals optimization opportunities before your users ever notice a problem.
Common Kubernetes Mistakes to Avoid in 2025
In 2025, Kubernetes isn’t just about running workloads - it’s about running them securely, efficiently, and intelligently. According to the Sysdig 2025 Kubernetes and Cloud-Native Security Report, 60% of containers live for less than one minute, while machine identities are now 7.5x riskier than human identities, and AI/ML workloads have exploded by 500%.
That’s the new reality: faster, smarter, and infinitely more complex.
Yet despite all these advancements, organizations still stumble on fundamental Kubernetes best practices - the kind that separate reliable clusters from costly chaos.
“Most Kubernetes issues in 2025 don’t come from innovation gaps - they come from ignoring the basics.”
Let’s break down the most common mistakes and how to fix them before they break your cluster (or your cloud bill).
1. Overprovisioning Nodes and Resources
Even with advanced autoscalers, many teams still allocate double what they need.
Real-time monitoring data from Sysdig shows that resource overprovisioning remains one of the top causes of unnecessary cloud spend, especially as teams scale AI/ML workloads.
Fix it:
Use proper resource requests and limits with Vertical Pod Autoscaler (VPA) for automated right-sizing.
resources:
  requests:
    cpu: "250m"
    memory: "512Mi"
  limits:
    cpu: "500m"
    memory: "1Gi"
💡 Pro tip: Monitor real CPU/memory trends in Prometheus or KodeKloud’s hands-on labs before adjusting limits.
2. Ignoring Security Policies
Sysdig’s 2025 report highlights a key shift: in-use vulnerabilities dropped below 6%, but image bloat has quintupled- meaning heavier, less-optimized images are still increasing attack surfaces.
Many clusters also skip security policies altogether, leaving room for privilege escalations and cross-pod attacks.
Fix it:
Apply Pod Security Standards and network restrictions early in your CI/CD pipeline.
apiVersion: networking.k8s.io/v1
kind: NetworkPolicy
metadata:
  name: restrict-access
spec:
  podSelector:
    matchLabels:
      role: backend
  ingress:
  - from:
    - podSelector:
        matchLabels:
          role: frontend
Combine this with image scanning (e.g., Trivy) and signing (e.g., Cosign) before deployments.
3. Skipping Regular Version Upgrades
Despite increased automation, 31% of organizations still run unsupported Kubernetes versions, often missing vital security and performance patches.
Each skipped release compounds tech debt - and increases API breakage risks.
Fix it:
Upgrade regularly and run deprecation checks before every major update.
kubectl convert -f old-deployment.yaml --output-version apps/v1 > updated.yamlUse tools likekube-no-troubleorkubectl preflightto identify deprecated APIs before upgrading.
4. Weak Observability and Reactive Monitoring
With 60% of containers living for under a minute, waiting for logs to reveal problems is no longer sustainable. The modern cluster demands real-time detection and response, something Sysdig notes can now happen in under 10 minutes - with top teams initiating responses in as little as 4 minutes.
Fix it:
Set up observability from day one. Use:
- Prometheus + Alertmanager for metrics
- Fluent Bit + Loki for logs
- OpenTelemetry for traces
helm install monitoring prometheus-community/kube-prometheus-stack \
  --namespace monitoring --create-namespace
Enable alerting for CPU throttling, pod restarts, and API latency before they turn into downtime.
5. Overprivileged RBAC Configurations
According to Sysdig, machine identities now outnumber human identities by 40,000x - and they’re far riskier. Overprivileged service accounts are the easiest entry point for attackers.
Fix it:
Apply least privilege with scoped roles and namespace restrictions.
kind: Role
apiVersion: rbac.authorization.k8s.io/v1
metadata:
  namespace: dev
  name: read-only-role
rules:
- apiGroups: [""]
  resources: ["pods", "services"]
  verbs: ["get", "list"]
Audit RBAC policies regularly using:
kubectl auth can-i --list --namespace devBonus Insight: Real-Time Security and Compliance
The Sysdig report also shows that EU-based organizations lead globally in compliance prioritization, driven by stricter data regulations and growing AI adoption.
This trend signals where Kubernetes is headed: integrated security, continuous monitoring, and policy-driven compliance.
If you’re managing Kubernetes in 2025, treat compliance as part of your architecture - not an afterthought.
Quick Recap
| Mistake | Real-World Impact | Fix |
|---|---|---|
| Overprovisioning | High cost, poor efficiency | Apply limits, use VPA |
| Ignoring security | Increased attack surface | PodSecurity + scanning |
| Outdated versions | Incompatibility, CVEs | Regular version upgrades |
| Weak observability | Slow detection | Full metrics-logs-traces pipeline |
| Overprivileged RBAC | Machine identity risk | Enforce least privilege |
Practice These Fixes the KodeKloud Way
You can apply every single one of these fixes in KodeKloud’s real Kubernetes environments:
- Kubernetes for the Absolute Beginners(KCNA) - learn safe setup and scaling
- Kubernetes Administrator (CKA) - master upgrades, autoscaling, and observability
- Kubernetes Security Specialist (CKS) - implement PodSecurity, RBAC, and image signing
- Kubernetes Security Basics(KCSA) - builds the essential skills to secure and protect cloud-native environments from threats.
- Kubernetes FREE Hands-On Labs - simulate real security and scaling incidents
No setup. No risk. Just real-world learning that mirrors the environments companies use today.
The Future of Kubernetes Excellence Lies in Practice
As 2025 unfolds, Kubernetes continues to evolve from a container orchestrator into a complete platform for modern infrastructure. The difference between teams that simply use Kubernetes and those that truly master it lies in one thing - consistent adherence to best practices.
Every trend we’ve seen this year reinforces that message:
- Scaling needs precision, not just power.
- Security requires constant vigilance, not static policies.
- Cost optimization depends on smart observability, not budget cuts.
- Performance tuning is no longer optional - it’s how you deliver reliable, user-first applications.
And as highlighted in reports from CNCF, Sysdig, and Logz.io, the modern Kubernetes landscape is fast, complex, and unforgiving. The clusters that thrive are the ones built on automation, visibility, and continuous learning.
Final Thought
Kubernetes best practices in 2025 aren’t static checklists - they’re habits.
Habits of observability, of security, of iteration, and of learning continuously.
Whether you’re managing a startup’s first cluster or scaling enterprise microservices across clouds, the key remains the same: understand deeply, automate wisely, and observe relentlessly.
Because in Kubernetes - as in DevOps - excellence isn’t achieved once. It’s practiced daily.
Learning by doing isn’t just a tagline - it’s how the world’s best DevOps engineers train.
Every KodeKloud lab is a live, browser-based environment that lets you experiment, fail, and improve safely - just like you would in production.
✅ Next Recommended Reads:
- Kubernetes Architecture Explained: Nodes, Pods, and Clusters
- Kubernetes Tutorial for Beginners 2025
- What is Kubernetes? A Beginner’s Guide to Container Orchestration
- Top Kubernetes Certification in 2025
- Quick Fixes for Common Kubernetes Issues
- Should I Use Kubernetes
- Kubernetes Horizontal Pod Autoscaler(HPA)
- kubectl Logs
- Kubernetes Basics in a Week Series
FAQ
Q1: How do I know if my Kubernetes cluster is overprovisioned or underutilized?
Check metrics like CPU and memory utilization trends using Prometheus or Kubecost. If usage rarely exceeds 40-50% of allocated resources, your cluster is likely overprovisioned - meaning you’re paying for idle capacity.
Q2: Is it better to run multiple smaller clusters or one big cluster in 2025?
It depends on your goals. Multiple clusters improve isolation and compliance but increase management overhead. One large cluster simplifies observability and scaling but raises blast radius risks. Many teams now adopt multi-cluster automation with GitOps + Fleet tools for balance.
Q3: What’s the biggest mistake teams still make with Kubernetes security?
Relying on default settings. Teams often skip enforcing Pod Security Admission, image signing, or least-privilege RBAC, leaving gaps attackers can exploit - especially with machine identities and AI/ML workloads now dominating clusters.
Q4: How can I detect hidden performance bottlenecks in Kubernetes?
Use OpenTelemetry traces across services and combine them with eBPF-powered tools like Cilium or Pixie to inspect latency at the kernel level. Logs alone won’t show cross-service bottlenecks - traces reveal what’s actually slowing down requests.
Q5: Do managed Kubernetes services (like EKS or GKE) remove the need for best practices?
Not at all. Managed services handle control-plane availability, but you’re still responsible for node tuning, security policies, and cost governance. Kubernetes best practices remain critical for your workloads even when the infrastructure is “managed.”
Q6: What are some underrated Kubernetes best practices most teams ignore?
- Limit container capabilities to avoid privilege escalation.
- Use namespace-based budgets and quotas to control spend.
- Set up continuous drift detection for policies and configurations.
- Regularly rotate TLS and service account tokens.
Q7: How do I make sure my Kubernetes scaling doesn’t trigger sudden cost spikes?
Set scaling thresholds based on business metrics (like request latency or queue depth), not just CPU utilization. This ensures autoscaling happens only when user experience demands it - not when background processes spike CPU briefly.




Discussion