Daemon:
I’ve tried this way,
- job_name: 'kubernetes-nodes'  # New Kubernetes nodes job
    kubernetes_sd_configs:
      - api_server: <https://xxxxxxx.azmk8s.io:443>
        role: node
        bearer_token: xxvnhfkvnfokdnmvromslmvkmvdkmvddxxxxx
        tls_config:
          insecure_skip_verify: true
Daemon:
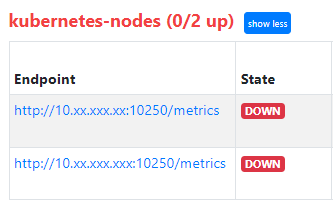
I’m getting like this:
Though My node-exporter is running at 9100 port
Alistair Mackay:
Port 10250 is the kubelet API port - those metrics are also useful.
Of course, it’s the node exporters you want. You’re using an autoscaler, so you’re running in Cloud, right? You can also use the cloud provider SD configs like https://prometheus.io/docs/prometheus/latest/configuration/configuration/#ec2_sd_config|EC2 to find actual VM instances using filter expressions, e.g on the tags they have, then in that config give the node exporter port.
Daemon:
Ok, What if the cluster belongs to AKS (Azure) ? because the cluster im using is AKS
Alistair Mackay:
There is an azure service discovery resource that will discover Azure VMs - as there is for GKE and several smaller cloud providers. They are all on the same documentation page.
Be aware also that if you only want node exporters on the kube nodes, it is also possible to deploy it as a daemonset, and then they can be discovered via kubernetes SD, and kube itself will ensure the node exporter is deployed if the autoscaler adds a node.
Daemon:
Yeah. I have deployed node-exporter as a daemonset. so that it runs on all nodes. and i have configured using kube_sd in prometheus.yml. It is automatically discovering the nodes. but the problem is with the ports. As i have shared above. It automatically going to :10250/metrics to scrape. But my node exporter is running in 9100 port. fixing that port in kube_sd config would be helpful.
Alistair Mackay:
There are various ways to configure sd_configs to find different things. It will be able to be done, but unfortunately I don’t have time or resources to build a complete lab to solve this for you.
There is a more detailed example of finding different objects here https://github.com/prometheus/prometheus/blob/release-2.47/documentation/examples/prometheus-kubernetes.yml
Alistair Mackay:
You could also post a question to https://github.com/prometheus/prometheus/issues explaining what you have done so far ans see if the prometheus community can give you a better answer.
Daemon:
Yeah Sure Alistair. Thanks:grinning: !!
Daemon:
 - job_name: 'kubernetes-nodes'
    kubernetes_sd_configs:
      - api_server: <https://cdjfvnjfcnjnvjdncjevjc:443>
        role: node
        bearer_token: vndjbsfjrvdsvebtfsfegbfsdretyruiovbrffcrvefnvruvnjunjvnjvnjrfnrwunt
        tls_config:
          insecure_skip_verify: true
    relabel_configs:
      - source_labels: [__meta_kubernetes_node_label_kubernetes_io_hostname]
        target_label: instance
      - action: labelmap
        regex: __meta_kubernetes_node_label_(.+)
      - source_labels: [__meta_kubernetes_node_address_InternalIP]
        target_label: __address__
        replacement: '${1}:9100'
It Worked with this configuration 
Daemon:
what would be the best/optimized way to setup monitoring according to you Alistair ?
I have to setup
-
node-exporter
-
windows-exporter
-
kube-state-metrics
In a cluster. So,
-
Should I Install prometheus along with the above 3 in a cluster and externalize only Grafana ( in a VM )
-
Or Should I Install only these exporters in the cluster and externalize prometheus and Grafana ( in a VM )
Ps: We’ve multiple clusters to monitor
Alistair Mackay:
If you want a single pane of glass view, then you either want a dedicated cluster to hold your monitoring and logging stacks, or run those externally on VMs. Personally I’d use the dedicated cluster approach because then it’s a bit easier to maintain
