


Say you're using a Linux server. Maybe your own physical server, or maybe running it in the cloud, somewhere. And it started to slow down. Is it time to upgrade? Or is some process misbehaving and eating up all your resources for no reason?
With some easy-to-run commands, you can find out:
- What's eating up all your CPU.
- What's eating up all your RAM.
- And what's reading, or writing intensively to your storage devices.
Let's get right into it.
How to Find Out What's Using Your CPU on a Linux Server
Often, the ps aux command is recommended. Or the top, or htop commands.
But htop has a small problem (with default settings). For example, if you use it to spot high CPU usage, it shows you what is CPU-intensive at this exact moment.
Let's say that some process used 100% of your CPU for the last hour. But at this exact moment, it's taking a break, and using 0%. htop will show it toward the bottom of the list. So you won't spot that it was "CPU-heavy" in the past. However, the ps command can easily spot processes that were CPU-intensive in the past.
The standard ps aux command, though? Not good enough.
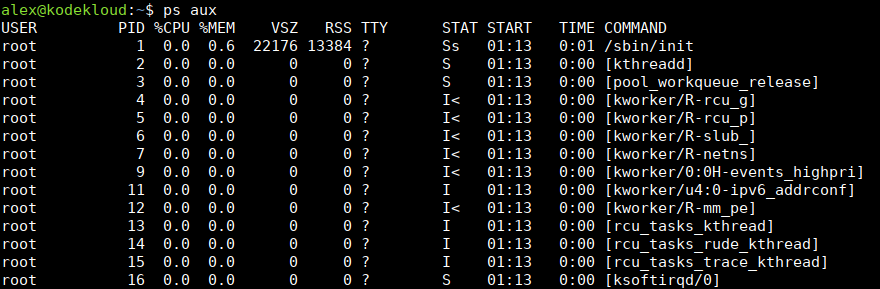
Processes are not sorted according to CPU usage. And there's too much data displayed for what you need.
Fortunately, the ps command is highly adaptable. You can sort according to CPU usage. And you can make the output short and sweet. Just run this:
ps -eo args,pid,etime,%cpu --sort=-%cpu | headHere's what this command does:
-eoption added to show all processes.-oto tell thepscommand what columns to output:args(arguments) to show the command that started the process.pid(process ID) to show the unique number identifying process.etimeto show elapsed time since the process started.%cputo show CPU percentage used by the process (average usage during its lifetime; so if it used 100% of one CPU core for 1 hour, and 0% in the next hour, the average would be around 50%). Note that you can see more than 100% here, explanation will be offered below.--sort=-%cputo put the CPU-intensive processes at the top. Note there's a-(minus) in here, in-%cpu. That's to sort in descending order, from highest to lowest CPU usage. Without the-it would be sorted in ascending order, from lowest to highest.
| headsends the output to a command calledheadto show only the first few results.
You'll get output like this:
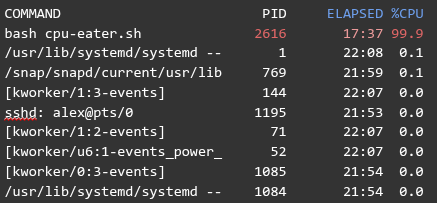
Simple, short, easy to read.
Look for processes at the top, with a large value in the %CPU column. 99.9% is roughly equivalent to an entire CPU core used all the time. So you could also see higher values here, like 199%, which would mean two CPU cores used intensively.
The ELAPSED field tells you how much time since this process was started.
And if you need to stop this process, use the PID number you see there.
How to Find Out What's Using Your RAM on a Linux Server
In a very similar way, you can use this command to see the processes that are using the most RAM (Random Access Memory) on your Linux server:
ps -eo args,pid,etime,%mem --sort=-%mem | headAlmost the same as the command from the previous section. But you just replace %cpu with %mem, to see memory usage.
You will get output like this:
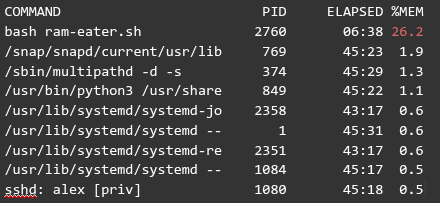
In this output, you can see a process with PID 2760 has been running for 6 minutes and 38 seconds. And it's using around 26.2% of memory available on the system.
You can read this blog if you need to terminate this process.
How to Find Out What's Reading, and Writing to Your Storage Devices on a Linux Server
The ps command is usually preinstalled on most Linux servers. But the next one you'll use, pidstat, might not be.
On operating systems like Ubuntu, Debian, or similar, install it with these two commands:
sudo apt update

sudo apt install sysstat
On RHEL, Rocky Linux, CentOS, or similar, use this command:
sudo dnf install sysstatThen run this to see what processes are reading, and writing to your storage devices:
pidstat -dl 1This command uses:
-doption to show input/output statistics (what data is going to, or coming from your storage devices). Think of it as-dfor disks, or devices.- -l (lowercase "L") to display the command that started the process, and its arguments.
- 1 (one) to make this output refresh every 1 second.
You'll get output like this:
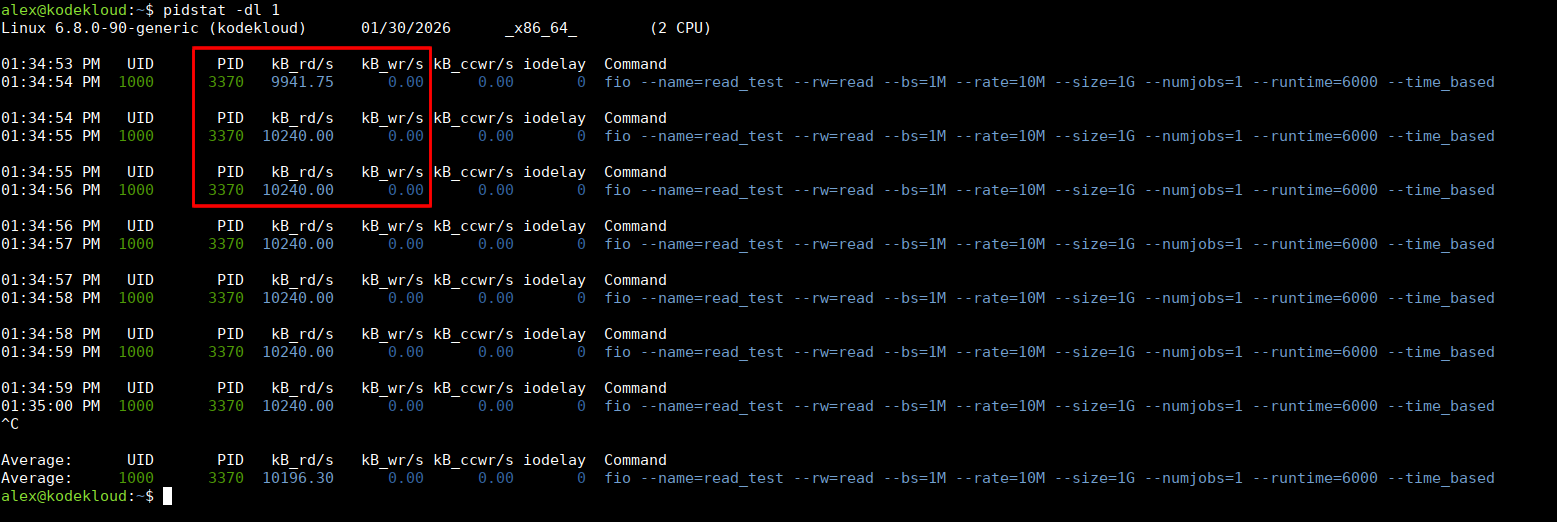
Showing you the PIDs (IDentification numbers) of processes interacting with your storage devices.
You can see how many kilobytes it's reading per second in kB_rd/s, and how many it's writing in kB_wr/s.
And that's about it. Now you know what's using your CPU, RAM, and storage devices. And figure out if it's normal behavior, because your server is "doing more stuff," handling more data. Or if it's because of a bug in some application stuck in a loop.
Hope this is helpful. See you in the next blog!


Discussion