


Why You Need to Understand System Architecture
Most people who start learning DevOps jump straight into commands:
- Running
docker run - Writing Kubernetes YAMLs
- Automating with Ansible
And sure, that’s fun. But then reality hits.
When you step into a real project, things feel different. Suddenly, it’s not just about running a container.
If you skip this part, troubleshooting feels like shooting in the dark. You’ll be stuck when your app works locally but fails in staging. You’ll struggle to understand why you can’t SSH into a server directly.
The missing piece is architecture.
What is the Nautilus Project?
The Nautilus Project has been part of KodeKloud for years. It’s not just a demo; it actually forms the backbone of the KodeKloud Engineer platform.
Whenever you solve a task in KKE or work through the 100 Days of DevOps challenge, you’re operating on an infrastructure inspired by Nautilus.
By studying Nautilus, you’re not just playing in a lab-you’re learning how a real production-like environment is built, step by step.
And once you understand it, everything else-commands, labs, troubleshooting-makes much more sense.
Layers of the Nautilus Architecture - Beginner Walkthrough
To make this easier to follow, let’s look at the Nautilus System Architecture diagram (the same design that powers KodeKloud Engineer):
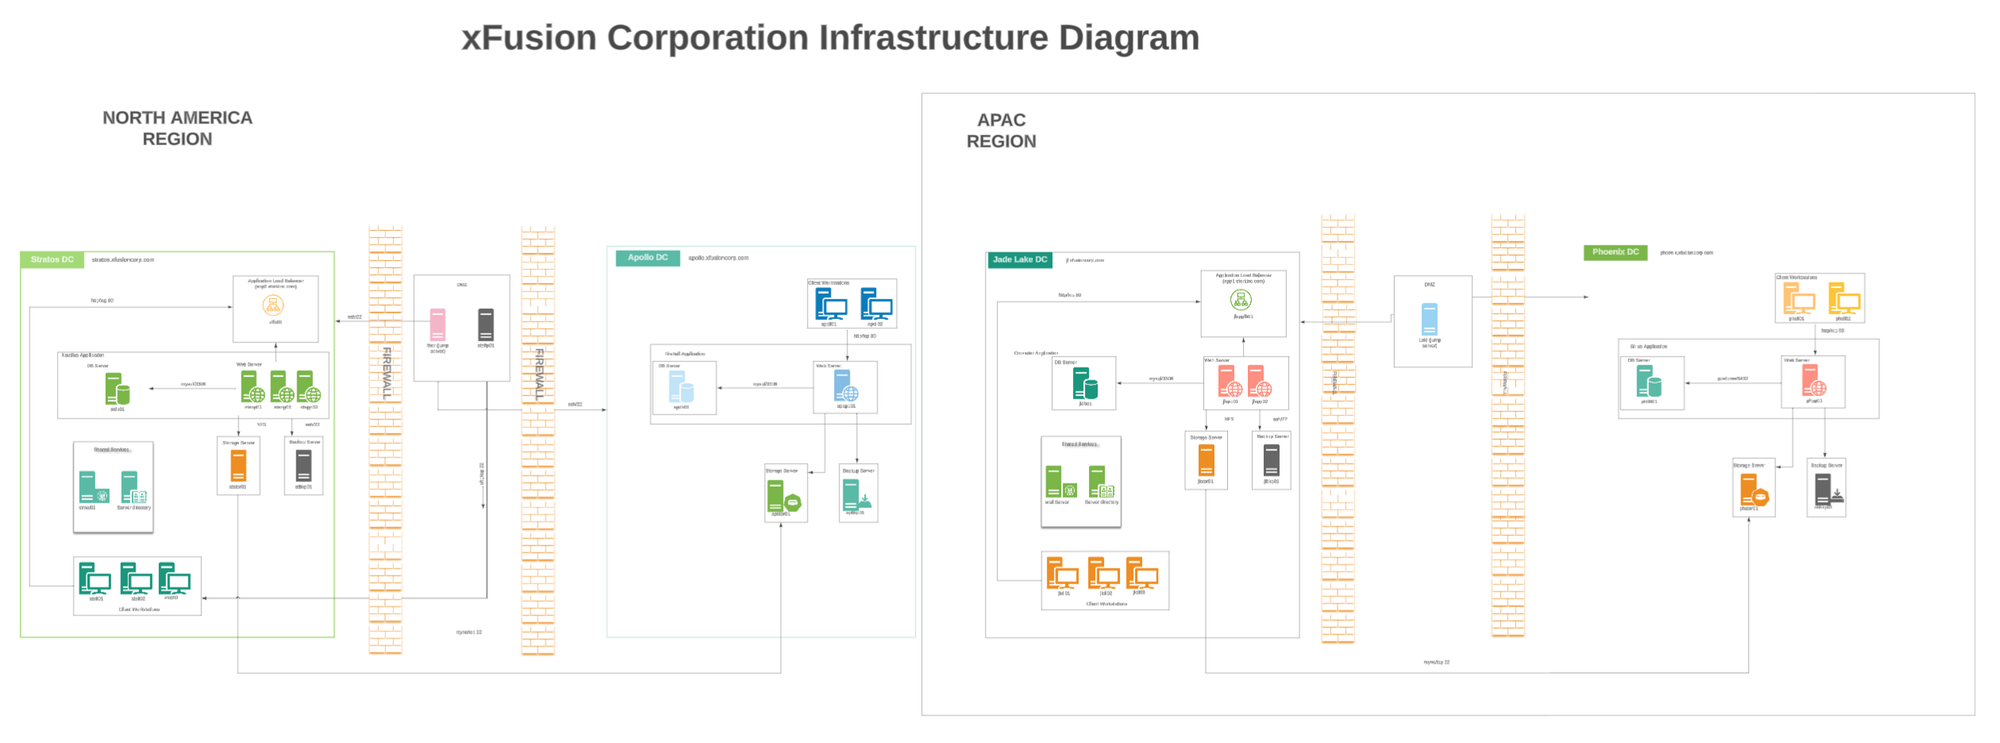
This diagram shows how different components-firewalls, load balancers, servers, and jump hosts-connect together.
Now let’s walk through it step by step, layer by layer.
Understanding Regions and Data Centers in the Nautilus Project
The Nautilus architecture is no different - at first glance you’ll see things like Stratos DC, Apollo DC, Jade Lake DC, and Phoenix DC scattered across the diagram. But if we slow down and take it layer by layer, it all makes sense.
Let’s start at the outermost layer: regions.
Regions - The Big Picture
A Region is a large geographic area where servers and services are grouped together. Think of it like saying “North America” or “Asia-Pacific.” Why split things by geography? Two big reasons:
- Speed (latency) - the closer the servers are to the users, the faster the response.
- Resilience - if one region has trouble, another can take over.
In Nautilus, the diagram shows two main regions:
- North America Region - serving users across the US and nearby countries.
- Asia-Pacific Region - serving users across Asia and Oceania.
And then there’s a special region called Phoenix, which is not for normal user traffic. Phoenix exists as a Disaster Recovery site - basically, a safety net if something goes terribly wrong in the main regions.
Data Centers - The Buildings Inside Each Region
Inside a region, you’ll find one or more Data Centers (DCs). If a region is like a city, a DC is like a building where all the servers, networking gear, and storage live. Different DCs play different roles: some run the full application stack, others act as lighter “edge” sites, and some are purely for backup and recovery.
Now let’s take a guided tour through each DC in the Nautilus diagram.
North America Region
The North America region has two data centers - Stratos and Apollo. Even though they’re in the same region, their jobs are very different.
Stratos DC - The Heavy Lifter
Stratos is the main entry point for users in North America. It’s a full-stack data center, which means it runs everything: web servers, application servers, databases, caching, storage, and backup systems.
Here’s what happens when traffic arrives at Stratos:
- First stop is the firewall, the security gate that only lets in approved traffic (like HTTPS on port 443).
- Next comes the load balancer, which spreads incoming requests across multiple web servers so no single machine gets overwhelmed.
- If the request is something simple, like fetching an image, the web servers handle it. But if it’s something deeper, like logging in or placing an order, the request moves down to the application servers.
- Those application servers talk to the database servers, where persistent data like user accounts and transactions are stored.
On the side, Stratos also has:
- Cache servers to speed things up by storing repeated queries.
- Storage servers for files and logs.
- Backup systems that ship data off to Phoenix for safekeeping.
Put simply, Stratos is the backbone of North America. It’s built for security (with firewalls and private tiers), scalability (with load balancing and multiple servers), and reliability (with backups flowing to Phoenix).
Apollo DC - The Edge Helper
Apollo looks smaller, but it plays an important role. It’s a web-only edge data center.
That means Apollo has a firewall and web servers - but no app tier and no database. So what’s the point?
Imagine a user in Chicago or Toronto loads the Nautilus app. Static files like HTML, CSS, and images can be served directly by Apollo. That’s fast. But if the request needs more - like a login or database query - Apollo forwards it securely to Stratos through an encrypted VPN/IPsec tunnel.
This way, Apollo reduces latency for nearby users while keeping all the sensitive logic and data centralized in Stratos. It’s like a regional outpost that speeds things up without holding the crown jewels.
Asia–Pacific Region
Now let’s jump across the ocean. The Asia-Pacific region has just one big data center: Jade Lake.
Jade Lake DC - The APAC Hub
Jade Lake is a full-stack DC, very similar to Stratos. It has the same layered design:
- Firewall at the front for security.
- Load balancer to distribute requests.
- Web tier for handling content.
- Application servers for business logic.
- Database servers for persistent storage.
Supporting systems like cache, storage, and backups are also in place here.
The main difference is geography: users in Asia don’t have to wait for their traffic to reach North America. Everything is handled locally in Jade Lake, making the experience much faster.
And just like Stratos, Jade Lake regularly ships backups to Phoenix.
Phoenix - The Disaster Recovery Site
Finally, we come to Phoenix. Unlike the others, Phoenix isn’t in the daily traffic path. You won’t see users being routed here. Instead, Phoenix exists as a standby safety net.
Phoenix continuously receives backups and replication data from both Stratos and Jade Lake. It might even keep warm standby servers running so it can be activated quickly.
Here’s the key difference: Phoenix has no public ingress. That means no users can connect directly to it. It’s a “dark site” - invisible until needed. If Stratos or Jade Lake fail, Phoenix can step in to restore services.
Phoenix also uses PostgreSQL instead of MySQL for its database tier. Why? Sometimes companies use a different DB engine in their DR site to test migrations, reduce vendor lock-in, or lower costs. So Phoenix doubles as both a disaster recovery site and a safe place to experiment with Postgres.
The Admin Layer - Jump Hosts and Client Workstations
So far, we’ve talked about how normal users reach Nautilus through firewalls, load balancers, and servers. But what about the people who run Nautilus behind the scenes? The system admins and engineers also need a way in.
Here’s the catch: admins can’t just open their laptops and directly SSH into a database or app server. That would be like leaving the backdoor of a bank wide open. Instead, Nautilus uses a dedicated admin layer.
Inside each data center, you’ll notice something called Client Workstations. These aren’t student devices or public users’ laptops. They represent secure, internal computers that Nautilus admins use. Think of them as special desks in a locked office-only trusted staff can sit there.
But even from these workstations, admins don’t jump straight into servers. First, they must go through a jump host (also known as a bastion host). The jump host acts like a guarded checkpoint. Once inside, admins can carefully “hop” into internal machines such as web, app, or database servers.
This setup enforces strong security:
- SSH (port 22) is only open from approved client workstations or trusted VPNs.
- Every login is logged and monitored.
- Access is restricted using the principle of least privilege (admins only get the keys they need, nothing more).
By forcing all admin traffic through these workstations and jump hosts, Nautilus ensures that even if hackers break into the public-facing web layer, the sensitive admin pathways remain locked down and closely watched.
In short:
- Client Workstations (inside the DCs) = secure entry points for admins.
- Jump Hosts = the one-and-only gateway into the private layers.
Together, they form a safety net that keeps Nautilus stable and secure.
How It All Ties Together
Now that you’ve seen each DC, you can step back and see the bigger picture:
- Stratos carries most of the North America load.
- Apollo helps reduce latency by serving web content closer to users.
- Jade Lake serves Asia–Pacific with its own full stack.
- Phoenix is the safety net, ready to take over if disaster strikes.
- Jump hosts keep admin access secure everywhere.
This layered design makes Nautilus not just functional, but also fast, secure, and resilient. It’s a system built to keep running smoothly no matter where in the world users are connecting from.
How Networking Glues Nautilus Together
Now that we’ve explored what each region and data center does, let’s zoom out and see how networking connects everything into one global system. You can think of the Nautilus architecture like a giant, secure highway system. Each request from a user is like a car starting a journey, and the network decides which route that car should take and which city (data center) it should arrive at.
Step 1: DNS - The Global Traffic Cop
When a learner or engineer launches their Nautilus lab, the very first thing that happens is not magic - it’s DNS (Domain Name System).
Instead of asking you to remember a string of numbers (an IP address), DNS lets you type something simple like app.nautilus.com. DNS then acts like a global traffic cop: it looks at where the user is in the world and decides which region and data center should serve them.
- If you’re in California, you’ll be sent to Stratos or Apollo DC in North America.
- If you’re in Singapore, DNS will point you to Jade Lake DC in Asia-Pacific.
Without DNS, every user would be stuck pointing to a single place, making the system slow and unreliable. With DNS, Nautilus can spread traffic intelligently and give everyone a smooth experience.
Step 2: Firewalls - The Security Gates
Once DNS points you to the right DC, your request arrives at the firewall. Think of the firewall as the locked front gate of a building, with guards only letting in people who belong there.
In Nautilus, firewalls are configured to:
- Allow web traffic on HTTP (80) and HTTPS (443), since that’s how users access apps.
- Allow SSH (22) but only from trusted admin sources through the jump host.
- Block everything else by default.
This means even if an attacker finds Nautilus servers on the internet, they can’t just start poking at random ports. The firewall enforces a “deny first, allow very selectively” model - one of the golden rules of secure networking.
Step 3: VPN/IPsec Tunnels - The Private Highways
Here’s where things get interesting. Not all requests can be served inside a single DC. For example, Apollo DC in North America only has a web tier. When it receives a request that requires business logic or database access, it needs to forward that request securely to Stratos.
This is where VPN (Virtual Private Network) and IPsec tunnels come in. Imagine two cities connected by a private underground highway. Cars (requests) can travel between the two cities, but no outsider can spy on them or hijack the road.
That’s exactly how Apollo and Stratos (and even Jade Lake) exchange data. They use encrypted tunnels across the internet, ensuring that even though traffic travels over public wires, it’s invisible to attackers.
Step 4: Routing and Load Balancing - Finding the Right Stop
Once your request is inside the data center, it still has to find the right “room” in the “building.” This is where routing and load balancing kick in.
- The routing rules act like a map, showing traffic where to go next.
- The load balancer makes sure no single web or app server gets overwhelmed.
For example:
- A request for a static image → goes straight to the web servers.
- A login request → passes from web servers to application servers.
- A database query → handled by the DB tier, often sped up by cache servers.
- File storage or logs → pushed to storage servers.
- Regular backups → shipped out to Phoenix DC for safety.
This entire flow is what makes Nautilus smooth for end users: they don’t see the complexity, but under the hood every request is carefully routed to the right place.
Why This Design Matters for Beginners
When you put this all together, you get a system that is:
- Fast → thanks to DNS directing users to the nearest DC.
- Secure → because of strict firewalls and encrypted tunnels.
- Reliable → with backups and DR in Phoenix, nothing is lost even if a whole region fails.
And most importantly - scalable. If more users join from Asia, Jade Lake can grow. If North America traffic explodes, Stratos can spin up more servers behind the load balancer.
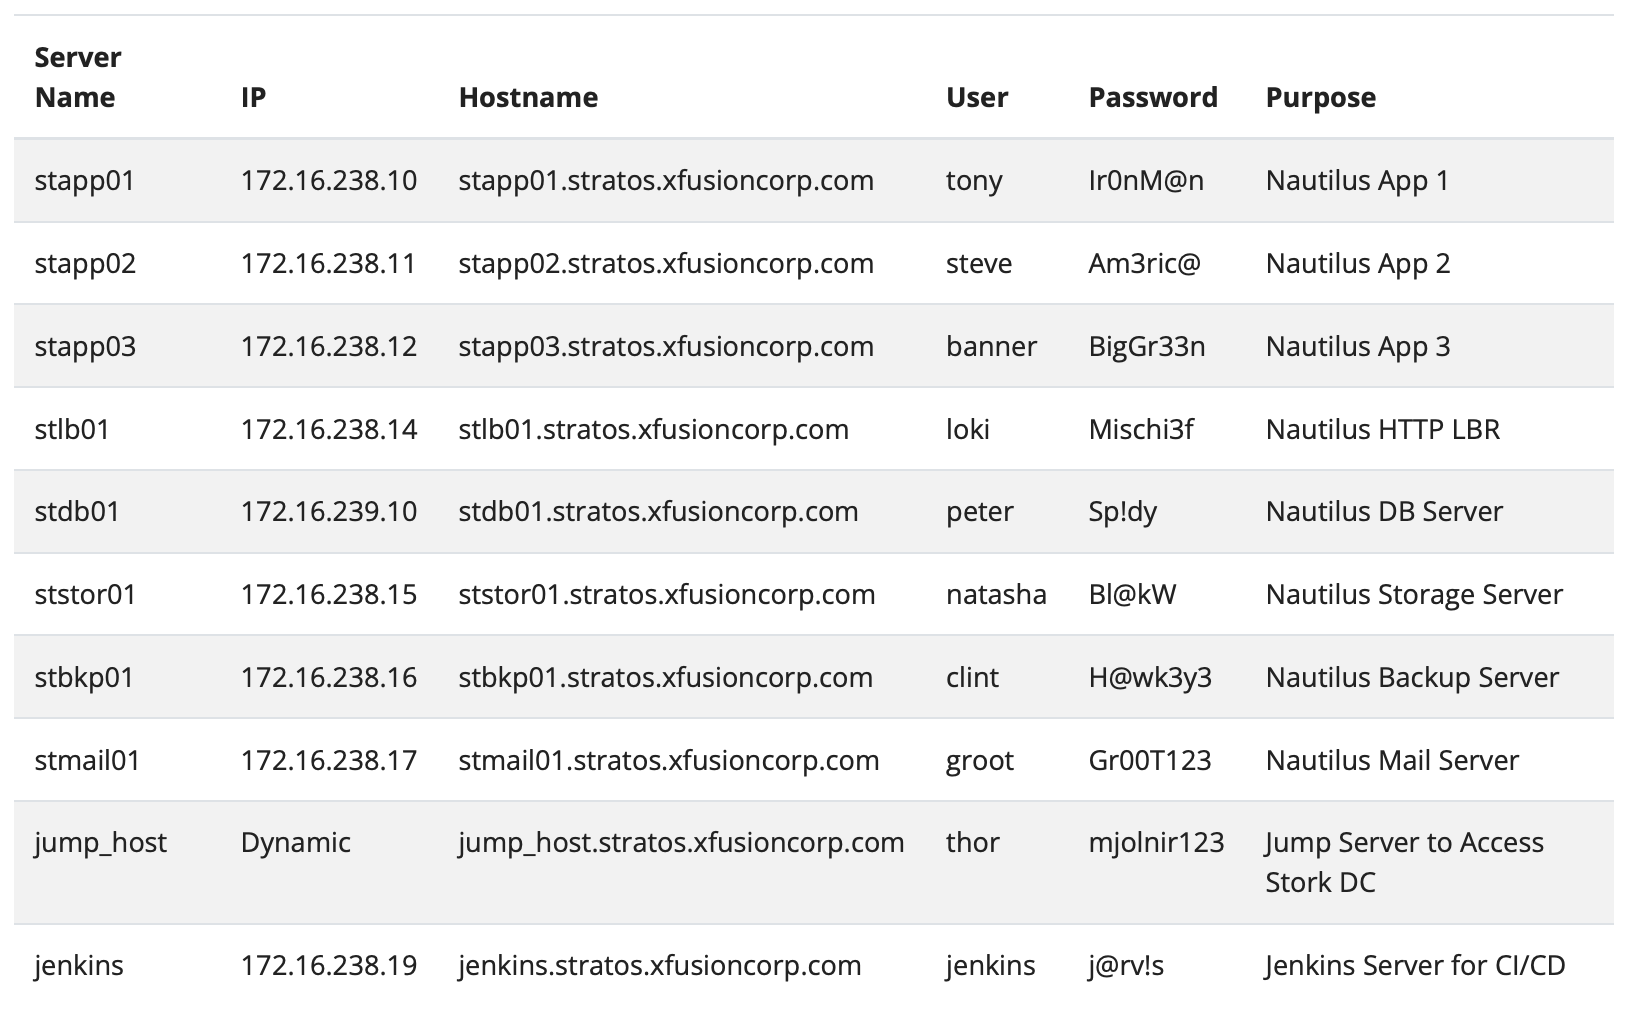
The Infrastructure Details - Who Does What?
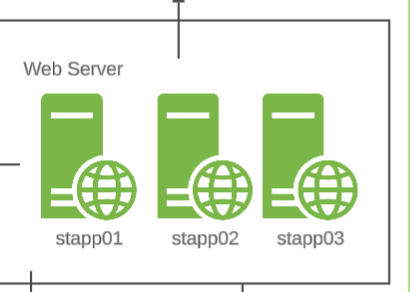
The Nautilus infrastructure is made up of several servers, each with a clear responsibility. The first group is the application servers: stapp01, stapp02, and stapp03. These are the machines where the Nautilus application itself runs. Whenever users access the application, their requests are handled here. Having three servers ensures that if one goes down, the others can still keep the application available, and traffic can be shared between them.
In front of these application servers sits the load balancer, stlb01. Its job is to distribute incoming requests among the three app servers so that no single one gets overloaded. This improves both performance and reliability, because the load is spread evenly.
The system also has a dedicated database server, stdb01. This server is where all structured information is stored, such as user data, application settings, and transactions. The app servers talk to the database whenever they need to fetch or save information. Without this database, the application cannot function.
For handling large files and unstructured data, there is a storage server, ststor01. Instead of overloading the application servers with large storage tasks, this machine is used to keep documents, images, or other media that the application may need. To protect against data loss, a backup server, stbkp01, works alongside the storage and database servers. It regularly creates copies of important data so that it can be restored if something goes wrong.
Communication is also part of the setup. The mail server, stmail01, is responsible for sending system emails such as account verification, password resets, and notifications. This is a standard component in most enterprise infrastructures.
When it comes to administration, direct access to servers is restricted for security reasons. Instead, administrators connect first to a jump host (jump_host). From there, they can securely reach the internal servers like the app, database, or storage servers. This setup protects the private parts of the system by controlling and monitoring all admin access through a single point.
Finally, the Jenkins server (jenkins) is used to automate deployments. Developers push their code, Jenkins tests it, and then automatically deploys it onto the application servers. This continuous integration and deployment process helps the team deliver updates quickly and with fewer errors.
How You Actually Connect to Nautilus
Now that you understand the Nautilus architecture and how its data centers are structured, let’s move to the next step: how you actually access and work on this infrastructure.
When you launch a KodeKloud Engineer lab, a black terminal window opens inside your browser. That’s not just a random Linux machine - it’s already connected to the Nautilus jump host.
The jump host is your secure doorway into the Nautilus data center.
👉 But here’s something important to note:
If you try to connect directly to Nautilus servers (like stapp01.stratos.xfusioncorp.com) from your personal laptop, it will not work. Why?
• Even if it resolves, the firewall blocks port 22 from the public internet.
• Result: your SSH request never reaches the jump host.
• DNS resolves to the private IP.
• Firewall allows SSH from internal sources.
• Result: connection succeeds and is routed correctly.
That’s why the lab terminal exists. It places you inside the private Nautilus environment, starting from the jump host. From there, you can safely SSH into the other servers:
- App servers (
stapp01,stapp02,stapp03) - Database server (
stdb01) - Storage and backup servers
- Mail and CI/CD servers
This design makes sure everything stays secure and hidden from outside traffic, while still giving you controlled access inside the KKE Lab.
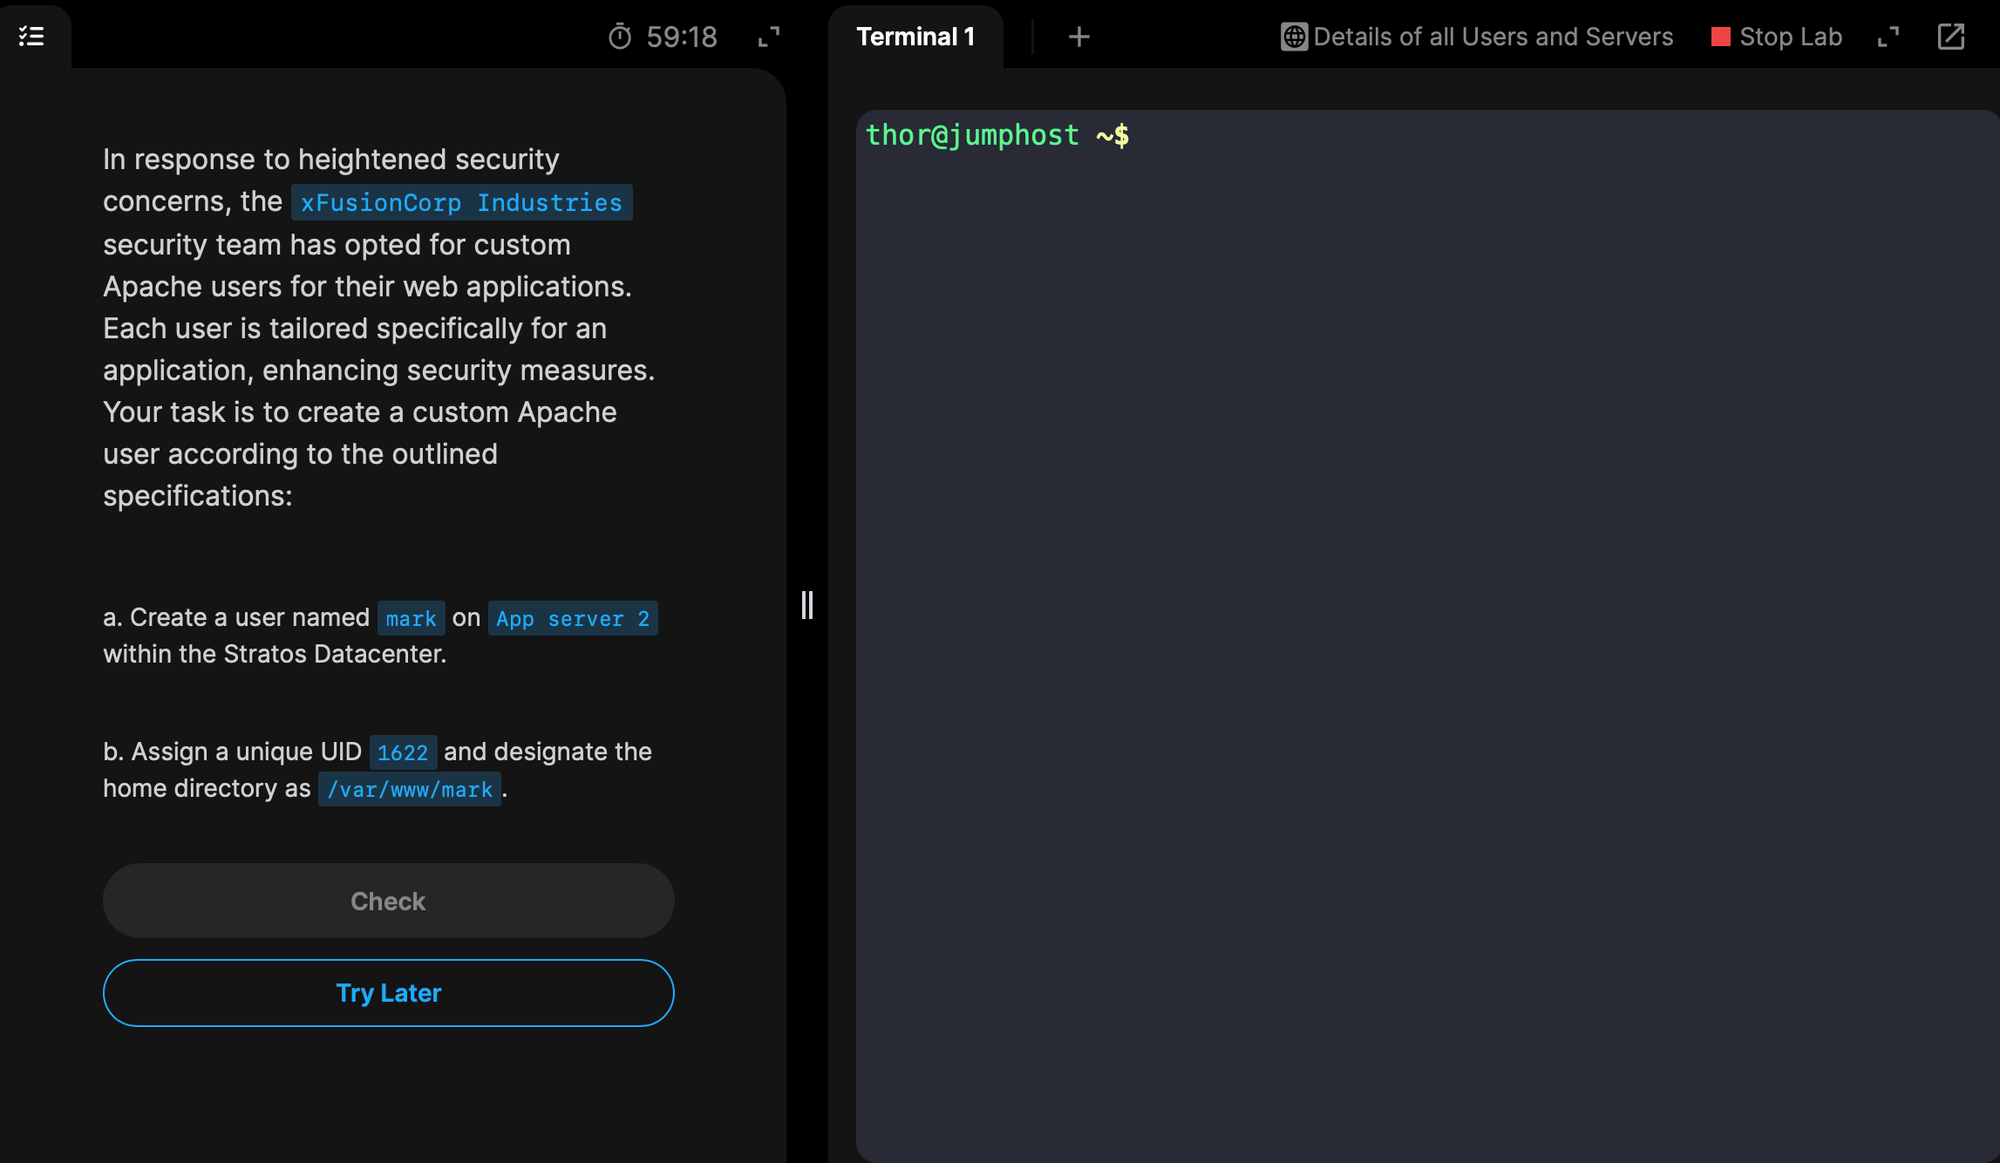
At the very top of that terminal, you’ll often see something like this:
thor@jumphost ~$ What does this mean? Let’s break it down step by step.
- thor → This is the username you are logged in as. In the Nautilus training labs, accounts like
thor,tony, orsteveare used to represent different team members of the Nautilus project. - @jumphost → This tells you that you are connected to a server called the jump host. You’re not on your personal laptop anymore - you’re inside Nautilus’s secure infrastructure.
- ~$ → This part shows the current directory (
~means home directory) and the shell prompt ($means you’re logged in as a normal user, not root).
So right from the start, you’re working inside Nautilus, not just on some random Linux box.
Navigating the Infrastructure Like a Real DevOps Engineer
In the Nautilus architecture diagram, you can see the jump host sitting between you (the engineer) and the internal servers (like the app servers and DB servers). When you open your lab terminal in the browser, you are already logged into this jump host.
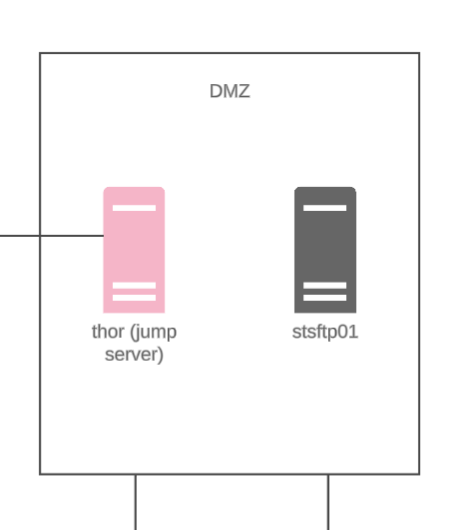
So, right now, you are standing inside the jump host. But the jump host is not the final machine you want to work on - it’s just your secure entry point. From here, you need to “hop” into other machines like App Server 01 inside the Stratos data center.
What is SSH?
To connect from the jump host to App Server 01, we use SSH (Secure Shell).
Here’s what beginners need to know about SSH:
- SSH is a protocol - a set of rules that allows one computer to securely connect to another.
- It uses encryption, meaning all your keystrokes, commands, and outputs are protected while traveling over the network.
- Instead of sitting physically in front of the server, SSH lets you control it remotely as if you were there.
So, in short: SSH = secure remote login into another machine.
Connecting to App Server 01
In the Nautilus labs, the app servers have hostnames like:
stapp01.stratos.xfusioncorp.com(App Server 01)stapp02.stratos.xfusioncorp.com(App Server 02)stapp03.stratos.xfusioncorp.com(App Server 03)
And they usually use private IPs (172.16.x.x), which is why you can only reach them from the jump host, not from your personal laptop.
The SSH command looks like this:
ssh tony@stapp01.stratos.xfusioncorp.comBreaking it down for beginners:
ssh→ the command to start an SSH connection.tony→ the username on App Server 01 (each app server has its own user: tony, steve, banner).stapp01.stratos.xfusioncorp.com→ the server name you want to connect to.
If it’s your first time, SSH will ask:
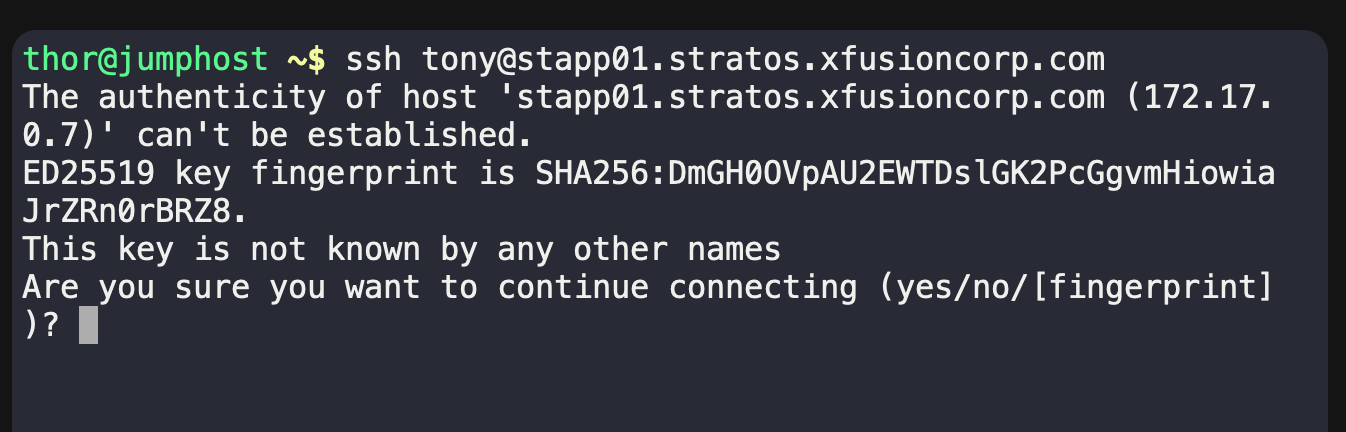
Type yes, and then it will ask for a password.
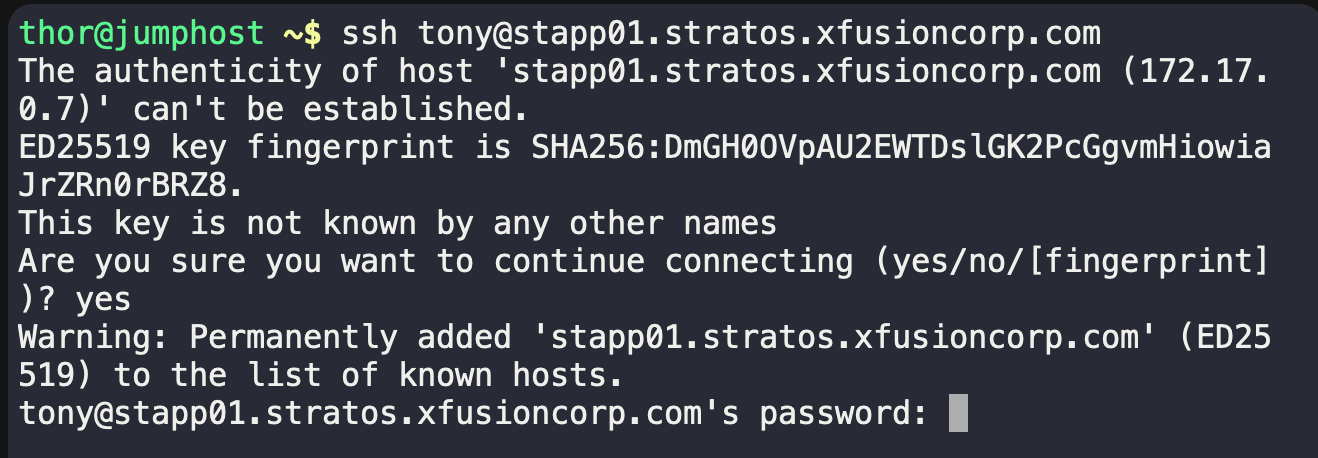
Once you enter it correctly, your terminal prompt will change to:
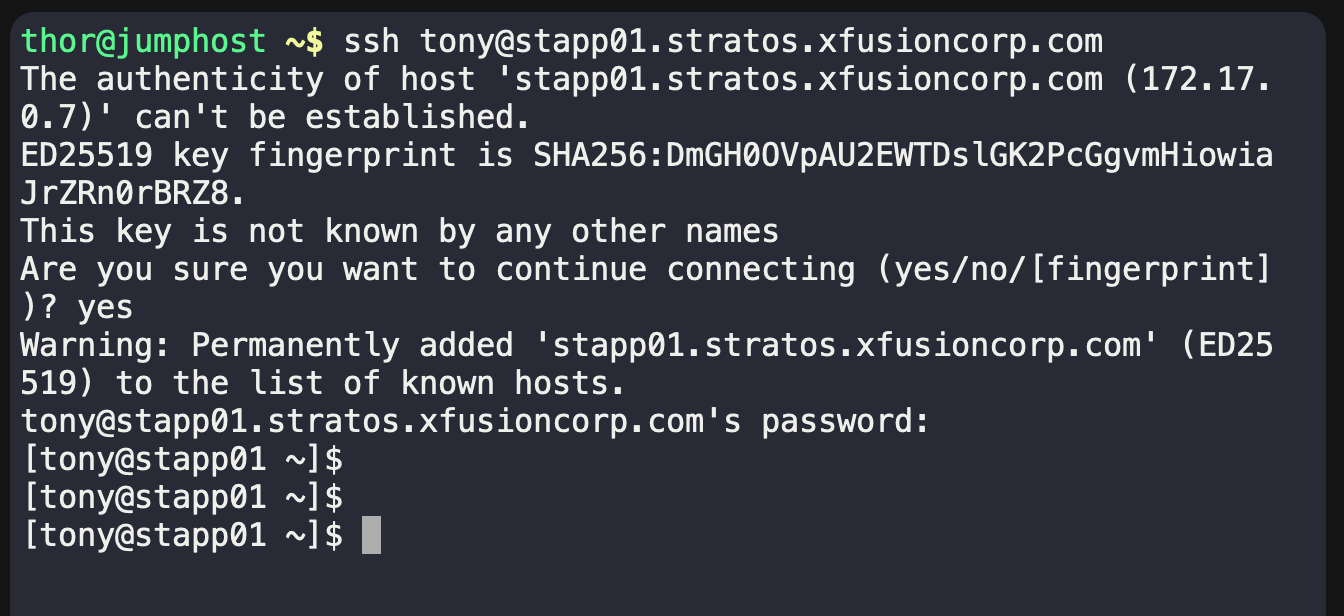
Now you are inside App Server 01.
See what just happened? With just a single SSH command, you moved from the jump host into App Server 01 inside the Stratos Data Center.
That’s a huge step - you didn’t just switch machines, you traveled across layers of the Nautilus architecture:
- From the jump host (your secure entry point),
- All the way into a web application server sitting deep inside the Stratos DC.
And all of that with just a few keystrokes.
What’s Next?
In this post, we walked through the Nautilus System Architecture step by step - starting from regions and data centers, down to firewalls, load balancers, web servers, app servers, databases, and finally how you, as a learner, connect through the jump host to actually work inside this infrastructure.
By now, you should have a clear picture of how all the moving parts fit together and why the Nautilus project is such a powerful way to learn real-world DevOps systems. You’ve seen how even a simple ssh command can take you from the edge of the system into the heart of a data center.
And this is just the beginning. 🚀
In the next blog, we’ll go beyond understanding the architecture. We’ll roll up our sleeves, log into these machines, and start performing real DevOps tasks - just like engineers do every day in IT companies. From managing services, to troubleshooting, to deploying apps - you’ll get hands-on with it all.
So stay tuned - the real fun begins when we start working on these servers like a real DevOps engineer.


Discussion